 Global| Mar 13 2008
U.S. Retail Sales Fell Unexpectedly, Discretionary Sales Mixed
by:Tom Moeller
|in:Economy in Brief
Summary
During February, U.S. retail sales fell an unexpected 0.6%, below the Consensus forecast for a 0.2% gain. Weak retail sales were generally expected during the last two months. The weakness didn't come in the initial January report but [...]
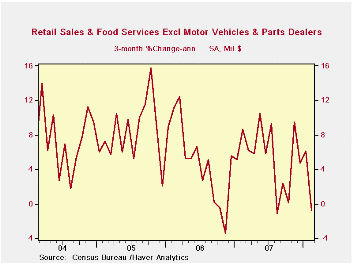
During February, U.S. retail sales fell an unexpected 0.6%, below the Consensus forecast for a 0.2% gain. Weak retail sales were generally expected during the last two months. The weakness didn't come in the initial January report but it was clearly evident in February. The sales decline reversed January's 0.4% gain which was little revised.
Sales of motor vehicles & parts provided much of the surprise to the reports for last month and for January. They fell 1.9% in February, reversing an unexpected 0.2% January gain. Expectations for both months were based on unit sales reports of a 0.3% m/m increase in February and a 5.4% January decline.
Retail sales excluding autos last month
fell 0.2% after a 0.5% January increase that was revised up slightly. A
0.5% December drop also was revised deeper. The February decline was
short of Consensus expectations for a 0.2% rise.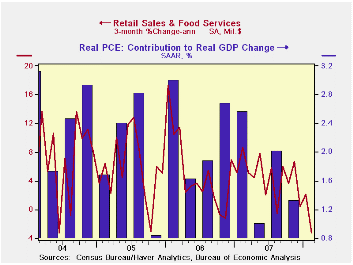
A 1.0% decline in sales at gasoline service stations was in line with a 0.5% drop in retail gasoline prices last month. So far in March gasoline prices are up roughly 5.5% m/m. Less gasoline & autos, February retail sales fell 0.1% and the January result was revised up.
Sales of discretionary items were mixed last month. Apparel store sales rose 0.2% (2.3% y/y) after an upwardly revised 2.2% January increase. Furniture, home furnishings & appliance store sales, however, fell 0.4% (-2.1% y/y) and they are down 2.8% during the last three months. Sales of electronics & appliances fell 0.4% (+0.5% y/y). Sales at general merchandise stores rose 0.4% (3.6% y/y) after little change during January.
Sales of nonstore retailers (internet & catalogue) fell 0.1% (+1.8% y/y) during February, for the third consecutive monthly decline, and earlier months' figures were revised lower.
Sales of building materials & garden equipment continued their recent decline and fell 0.7% (-4.2% y/y). Since their peak early in 2006 these sales are down 8.3%.
Food & beverage store sales fell 0.2% (+4.3% y/y) last month. Restaurant & drinking place sales fell 0.4% (+4.6% y/y).
| February | January | Y/Y | 2007 | 2006 | 2005 | |
|---|---|---|---|---|---|---|
| Retail Sales & Food Services | -0.6% | 0.4% | 2.6% | 4.0% | 6.2% | 6.6% |
| Excluding Autos | -0.2% | 0.5% | 4.4% | 4.5% | 7.4% | 7.6% |
| Less Gasoline | -0.1% | 0.2% | 2.4% | 4.3% | 7.2% | 6.6% |
by Tom Moeller March 13, 2008
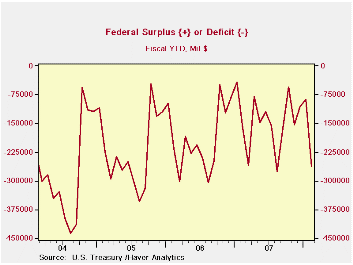
The U.S. government ran a budget deficit of $175.6B last month, quite a bit higher than last year's February deficit of $120B.
For the first five months of FY08 the government ran a budget deficit of $263.3B versus a deficit of 162.2B during the first five months of FY07.
For the fiscal year to date, growth in federal receipts slowed
to just 1.3%, down from 9.3% growth during the first five months of
FY07. Lower stock prices and the weaker economy with its slower
employment growth stalled growth in individual income tax receipts (44%
of total receipts) at 0.7% from 12.8% last FYTD. Withheld income taxes
grew 5.3%, half the rate of gain last year, but non-withheld taxes grew
just 3.6% versus 20.9% growth during the five months of FY07.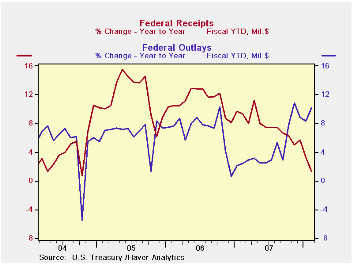
Corporate income taxes (13% of total receipts) fell 4.8% due to lower corporate profits. During FY07 they rose 16.5% during the first five months. Unemployment insurance receipts fell 6.1% due to lower employment growth.
U.S. net outlays grew 10.2% early this fiscal year and that was nearly four times the growth early in FY07. Growth in defense spending (19% of total outlays) surged to 27.8% while Medicare expenditures (12% of outlays) surged 47.3%. Growth in social security spending (21% of outlays) held about steady at 4.8% but interest expense fell 1.5% as interest rates backed down a bit.
The Government's financial data is available in Haver's USECON database.
| US Government Finance | February | January | Y/Y | FY 2007 | FY 2006 | FY 2005 |
|---|---|---|---|---|---|---|
| Budget Balance | -$175.6B | $17.8B | -$120.0B (2/07) | -$162.0B | -$248.2B | -$318.7B |
| Net Revenues | $105.7B | $255.2B | -12.1% | 6.7% | 11.8% | 14.1% |
| Net Outlays | $281.3B | $237.4B | 17.1% | 2.8% | 7.4% | 7.6% |
by Tom Moeller March 13, 2008
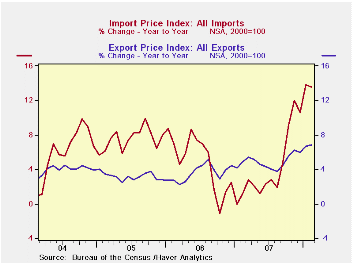
Overall import prices during February gained only 0.2% after a very firm, little revised 1.6% January increase. Expectations had been for a stronger 0.8% rise last month.
Petroleum prices fell an unexpected 0.5% after a 4.8% surge in January. That decline helped industrial materials prices to rise just 0.2%, but crude petroleum prices look to be up 8.0% this month versus February.
Less petroleum import prices were strong again last month and rose 0.6%. The lower foreign exchange value of the dollar has pushed the y/y increase in these prices to 4.5%, the strongest rate of increase since 1995.
During
the last ten years there has been a 66% (negative) correlation between
the nominal trade-weighted exchange value of the US dollar vs. major
currencies and the y/y change in non oil import prices. The correlation
is a reduced 47% against a broader basket of currencies.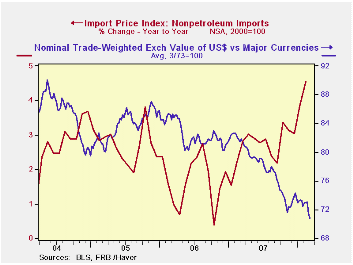
Prices for industrial supplies & materials excluding petroleum surged again, last month by 2.5% (12.5% y/y) led by another surge in chemical prices (23.9% y/y). Finished metal prices also have been strong (12.4% y/y) as have been paper prices (2.3% y/y). They are recovering after deflation last year. The detailed import price series can be found in the Haver USINT database.
Capital goods import prices rose just 0.1% (0.9% y/y) but that y/y gain follows a 0.4% increase last year and a 0.7% decline in 2006. Prices of computers, peripheral and semiconductors fell 0.5% last month (-5.0% y/y). Less the high tech sector, capital goods prices rose 0.3% (3.4% y/y) and here again the y/y increase is well elevated from a 2.7% rise last year and a 1.4% 2006 gain.
Finally, prices for nonauto consumer goods imports rose 0.3% in February (2.1% y/y) and the y/y rise in prices is now up from a 1.6% 2007 increase and a 0.4% uptick during 2006. Apparel prices are well up (2.0% y/y), double the rise of last year.
Total export prices have been quite strong with the 6.8% y/y gain led by a 30.8% jump in agricultural prices. That is followed by an accelerated 4.6% y/y gain in nonagricultural export prices which rose 3.6% last year.
Today's remarks by Treasury Secretary Henry M. Paulson, Jr. can be found here.
| Import/Export Prices (NSA) | February | January | Y/Y | 2007 | 2006 | 2005 |
|---|---|---|---|---|---|---|
| Import - All Commodities | 0.2% | 1.6% | 13.6% | 4.2% | 4.9% | 7.5% |
| Petroleum | -0.5% | 4.8% | 60.9% | 11.6% | 20.6% | 37.6% |
| Non-petroleum | 0.6% | 0.7% | 4.5% | 2.7% | 1.7% | 2.7% |
| Export- All Commodities | 0.9% | 1.2% | 6.8% | 4.9% | 3.6% | 3.2% |
by Tom Moeller March 13, 2008
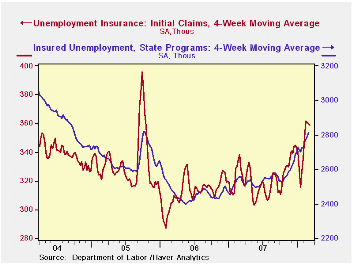
Initial claims for unemployment insurance were unchanged last week at 353,000 from the prior week's level which was revised up slightly. The figure about matched Consensus expectations and it left the early March level of claims slightly below the February average.
A claims level below 400,000 typically has been associated with growth in nonfarm payrolls. During the last ten years there has been a (negative) 76% correlation between the level of initial claims and the m/m change in nonfarm payroll employment.
The four week moving average of initial was about unchanged w/w at 358,500 (9.4% y/y).
Continuing claims for unemployment insurance moved higher again. A 7,000 increase during the latest week followed a 26,000 gain during the prior period which was unrevised. Insured unemployment stood at its highest level since Summer 2005. The figure provides some indication of workers' ability to find employment.
The continuing claims numbers lag the initial claims figures by one week.
The insured rate of unemployment remained at 2.1% for the sixth consecutive week.
| Unemployment Insurance (000s) | 03/07/08 | 02/29/08 | Y/Y | 2007 | 2006 | 2005 |
|---|---|---|---|---|---|---|
| Initial Claims | 353 | 353 | 12.4% | 322 | 313 | 331 |
| Continuing Claims | -- | 2,835 | 9.8% | 2,551 | 2,459 | 2,662 |
by Robert Brusca March 13, 2008
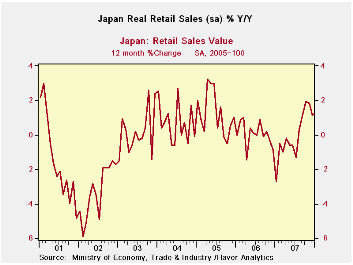
Japan’s seasonally adjusted headline sales spurted over six months then slowed over three months. The three-month slowdown however is at a slightly slower pace than year-to-year sales. On the quarter-to-date sales are better than their year/yearr pace and better than their three-month pace.
For not seasonally adjusted data, Japan’s January retail sales also jumped over six months compared to 12 months ago, but over the recent three months sales were much weaker and generally back to their year/year pace (a little better). In the current quarter too, Japan retail sales are advancing at a pace close to the pace they posted over the past year. These trends apply to most retail sales components.
Motor vehicles are one category that is an exception to some of these generalities. MV sales did spurt over six months and slowed from that pace over 3 months but the three-month pace has remained above the year/year pace and as a result the quarter to date pace is also elevated. But since MV sales are volatile it is never possible to know if it is spurting and will have legs or will dissipate or even reverse. Japan’s economy has been engaged in a long slowdown. But recently several of its cyclical measures have shown some upside. Auto sales may be another one of those new bright signs.
| Japan Retail Sales Trends | ||||||||
|---|---|---|---|---|---|---|---|---|
| Jan-08 | Dec-07 | Nov-07 | 3-mo | 6-mo | 12-mo | Yr-Ago | Q-to-Date | |
| Total | 0.6% | -0.8% | 0.7% | 1.8% | 7.2% | 1.2% | -4.7% | 1.6% |
| Motor Vehicles | 2.9% | -0.8% | 0.1% | 8.5% | 17.7% | 5.6% | -14.2% | 14.7% |
| Food & Beverage | 0.2% | -0.2% | -0.1% | -0.5% | 2.6% | 0.4% | 2.4% | 0.1% |
| Fabric apparel & accessories | 1.2% | -2.6% | 1.5% | 0.0% | 6.2% | 0.0% | -24.6% | -0.7% |
| Rest of Retail | 0.2% | -0.9% | 1.2% | 1.9% | 7.8% | 0.9% | -3.0% | 0.1% |
by Robert Brusca March 13, 2008
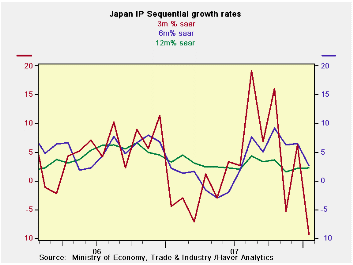 Japan’s index of industrial
output was revised lower. But the
general growth trend remains in force. Year/year output trends are
fairly stable at a moderate 2% or so rate of growth. Over six months,
trends point lower; over 3 months trends point sharply lower.
Japan’s index of industrial
output was revised lower. But the
general growth trend remains in force. Year/year output trends are
fairly stable at a moderate 2% or so rate of growth. Over six months,
trends point lower; over 3 months trends point sharply lower.
All major industrial and product growth sectors show weakness in the recent one-month and three-month periods. Textiles, investment goods and mining show the more persisting decelerating trends.
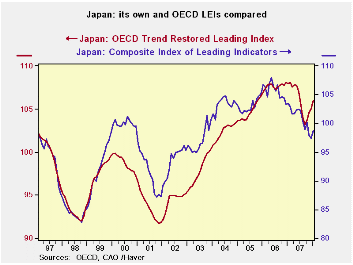
However, different leading indicators tell different stories
about Japan’s economy and where it is going. The OECD sees an upturn in
progress in six months, as its CLI has turned higher. Japan’s own
leading index is still locked in a downtrend going back to 2006.
The recent surge in the yen comes against this mixed background. In the past the yen has not been able to rise strongly unless the domestic economy was doing well. But in this case the yen’s rise is the counter part of the dollar’s ubiquitous fall. The yen may be driven more by the US and by yen funding unwinds than by Japan’s own fundamentals. The BOJ is not talking of intervention, indeed, the Keidanren, the influential Japan employers union, said it would not ask for intervention unless the dollar got much stronger.
Japan’s exports have been holding up and there is some talk of
improved productivity in Japanese companies. But the dollar’s move up
could put all of this in jeopardy. Year-over-year output trends remain
steady but over shorter horizons we do have something to think about.
| Japan Industrial Production Trends | |||||||
|---|---|---|---|---|---|---|---|
| m/m % | Saar % | Yr/Yr | |||||
| seas adjusted | Jan-08 | Dec-07 | Nov-07 | 3-mo | 6-mo | 12-mo | Yr-Ago |
| Mining & MFG | -2.2% | 1.4% | -1.6% | -9.3% | 2.6% | 2.2% | 3.2% |
| Total Industry | -2.6% | 1.7% | -1.3% | -8.6% | 3.4% | 2.3% | 2.6% |
| MFG | -2.2% | 1.4% | -1.6% | -9.6% | 2.6% | 2.1% | 3.2% |
| Textiles | -3.0% | 2.5% | -2.2% | -10.2% | -8.6% | -5.6% | -4.2% |
| Transport | -3.2% | 2.4% | -2.9% | -14.2% | 31.5% | 11.6% | 4.6% |
| Product Group | |||||||
| Consumer Goods | -1.7% | 2.1% | -2.1% | -6.8% | 12.8% | 4.0% | -0.8% |
| Intermediate Goods | -2.8% | 1.3% | -1.1% | -10.3% | 3.1% | 4.0% | 3.8% |
| Investment Goods | -0.8% | -0.6% | -1.9% | -12.6% | -8.3% | -3.8% | 5.8% |
| Mining | -2.9% | 1.1% | -5.9% | -27.2% | -15.9% | -5.1% | 3.5% |
| Electricity & Gas | -1.9% | 0.2% | 2.0% | 1.0% | 14.0% | 5.3% | -2.8% |

Tom Moeller
AuthorMore in Author Profile »Prior to joining Haver Analytics in 2000, Mr. Moeller worked as the Economist at Chancellor Capital Management from 1985 to 1999. There, he developed comprehensive economic forecasts and interpreted economic data for equity and fixed income portfolio managers. Also at Chancellor, Mr. Moeller worked as an equity analyst and was responsible for researching and rating companies in the economically sensitive automobile and housing industries for investment in Chancellor’s equity portfolio. Prior to joining Chancellor, Mr. Moeller was an Economist at Citibank from 1979 to 1984. He also analyzed pricing behavior in the metals industry for the Council on Wage and Price Stability in Washington, D.C. In 1999, Mr. Moeller received the award for most accurate forecast from the Forecasters' Club of New York. From 1990 to 1992 he was President of the New York Association for Business Economists. Mr. Moeller earned an M.B.A. in Finance from Fordham University, where he graduated in 1987. He holds a Bachelor of Arts in Economics from George Washington University.
More Economy in Brief


