 Global| Feb 15 2004
U.S. Retail Sales Fell, Nonauto Spending Moderate
by:Tom Moeller
|in:Economy in Brief
Summary
US retail sales fell 0.3% in January, about as expected due to a 3.3% (+5.6% y/y) decline in spending on motor vehicles. The 1.1% rise in December sales was little revised. Sales excluding motor vehicles rose 0.6% following an [...]
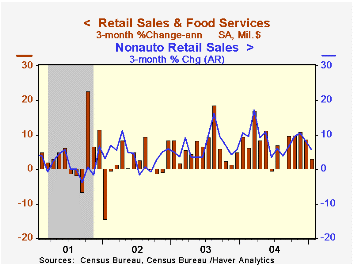
US retail sales fell 0.3% in January, about as expected due to a 3.3% (+5.6% y/y) decline in spending on motor vehicles. The 1.1% rise in December sales was little revised.
Sales excluding motor vehicles rose 0.6% following an unrevised 0.4% increase in December. Consensus expectations had been for a 0.5% gain.
Spending on discretionary items was mixed last month. Apparel store sales jumped 1.8% (3.9%) following two months of decline and sales at general merchandise stores gained 0.9% (6.5% y/y). Sales at furniture & home furnishings stores fell 0.4% (+1.9% y/y) for the third consecutive monthly decline and building material store sales fell 0.3% (+14.1% y/y).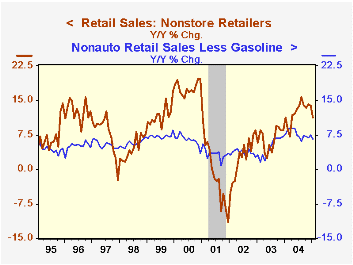
Sales of nonstore retailers (internet and catalogue) fell 0.2%, 11.3% y/y, but these sales have risen to 9% of nonauto retail sales less gasoline versus less than 7% ten years ago.
Gasoline service station sales recovered 1.8% (17.3% y/y) even though gasoline prices fell slightly last month. Nonauto retail sales less gasoline rose 0.5% (6.6% y/y) in January. In February gasoline prices have risen 4.0% versus January.
| Jan | Dec | Y/Y | 2004 | 2003 | 2002 | |
|---|---|---|---|---|---|---|
| Retail Sales & Food Services | -0.3% | 1.1% | 7.2% | 7.6% | 5.3% | 2.5% |
| Excluding Autos | 0.6% | 0.3% | 7.6% | 8.5% | 5.2% | 3.2% |
by Tom Moeller February 15, 2005
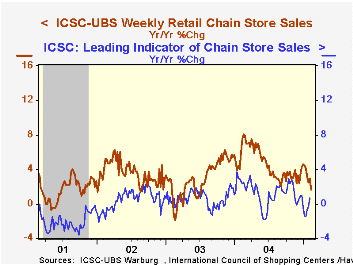
Chain store sales inched up another 0.1% last week following the 2.2% spike the prior week according to the International Council of Shopping Centers (ICSC)-UBS survey.
The rise lifted sales in early February 0.7% ahead of the January average which rose 0.9% from December.
During the last ten years there has been a 58% correlation between y/y change in chain store sales and the change in non-auto retail sales less gasoline, as published by the US Census Department.
The leading indicator of chain store sales from ICSC rose 0.3% in early February (+0.7% y/y).
The ICSC-UBS retail chain-store sales index is constructed using the same-store sales (stores open for one year) reported by 78 stores of seven retailers: Dayton Hudson, Federated, Kmart, May, J.C. Penney, Sears and Wal-Mart.
| ICSC-UBS (SA, 1977=100) | 02/12/05 | 02/05/05 | Y/Y | 2004 | 2003 | 2002 |
|---|---|---|---|---|---|---|
| Total Weekly Chain Store Sales | 446.2 | 445.8 | 1.7% | 4.6% | 2.9% | 3.6% |
by Tom Moeller February 15, 2005
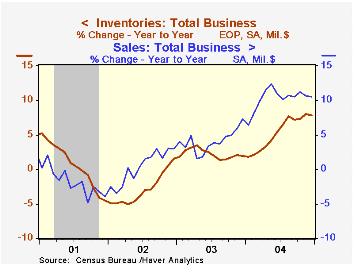
Total business inventories rose another 0.2% after the 1.1% surge in November. The full year increase of 7.8% was the strongest since 1988.
Retail inventories rose 0.3% in December following a 1.1% increase the prior month. Accumulation of non-auto retail inventories jumped for the second month, up 1.0%, and the year's accumulation was the strongest in ten led by a 16.9% y/y gain in building materials. Inventories of furniture (6.8% y/y) and general merchandise (6.4% y/y) also rose strongly though apparel accumulation slowed to just 1.0%.
Wholesale inventories rose another 0.4% and the yearly gain of 11.2% was a record. During the last ten years there has been a 64% correlation between the y/y change in wholesale inventories and the change in imports of merchandise.
Overall business sales jumped 1.0% (+10.6% y/y) on the strength of yearend auto sales.
The ratio of inventories-to-sales fell slightly back to the record low of 1.30. Moreover, though the rate of inventory accumulation more than quadrupled last year, it lagged the double digit gain in sales.
| Business Inventories | Dec | Nov | 2004 | 2003 | 2002 |
|---|---|---|---|---|---|
| Total | 0.2% | 1.1% | 7.8% | 1.9% | 1.5% |
| Retail | 0.3% | 1.1% | 6.0% | 5.0% | 6.0% |
| Retail excl. Autos | 1.0% | 1.1% | 6.4% | 2.9% | 2.6% |
| Wholesale | 0.4% | 1.2% | 11.2% | 2.2% | 0.4% |
| Manufacturing | -0.1% | 1.0% | 7.3% | -1.3% | -1.8% |
by Tom Moeller February 15, 2005
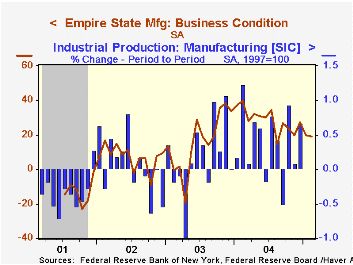
The Empire State Index of General Business Conditions in New York's manufacturing industries added another point in February to the seven point decline in January and fell to 19.19. The index has fallen twenty points from its level one year ago.
The new orders component fell for the fourth month in the last five and also is down twenty points from its peak. The employment measure fell to its lowest since late 2003. Like the Philadelphia Fed Index of General Business Conditions, the Empire State Business Conditions Index reflects answers to an independent survey question; it is not a weighted combination of the components.
The prices paid index eased modestly.
Expectations for business conditions in six months again fell for the fifth consecutive month to the lowest level since March 2003.
The Empire State Manufacturing Survey is a monthly survey of manufacturers in New York State conducted by the Federal Reserve Bank of New York. Participants from across the state in a variety of industries respond to a questionnaire and report the change in a variety of indicators from the previous month. Respondents also state the likely direction of these same indicators six months ahead. April 2002 is the first report, although survey data date back to July 2001.
For more on the Empire State Manufacturing Survey, including methodologies and the latest report, click here.
The Predictive Abilities of the New York Fed's Empire State Manufacturing Survey from the Federal Reserve Bank of New York is available here.
| Empire State Manufacturing Survey | Feb | Jan | Feb '04 | 2004 | 2003 | 2002 |
|---|---|---|---|---|---|---|
| General Business Conditions (diffusion index) | 19.19 | 20.08 | 39.57 | 28.76 | 16.17 | 7.19 |

Tom Moeller
AuthorMore in Author Profile »Prior to joining Haver Analytics in 2000, Mr. Moeller worked as the Economist at Chancellor Capital Management from 1985 to 1999. There, he developed comprehensive economic forecasts and interpreted economic data for equity and fixed income portfolio managers. Also at Chancellor, Mr. Moeller worked as an equity analyst and was responsible for researching and rating companies in the economically sensitive automobile and housing industries for investment in Chancellor’s equity portfolio. Prior to joining Chancellor, Mr. Moeller was an Economist at Citibank from 1979 to 1984. He also analyzed pricing behavior in the metals industry for the Council on Wage and Price Stability in Washington, D.C. In 1999, Mr. Moeller received the award for most accurate forecast from the Forecasters' Club of New York. From 1990 to 1992 he was President of the New York Association for Business Economists. Mr. Moeller earned an M.B.A. in Finance from Fordham University, where he graduated in 1987. He holds a Bachelor of Arts in Economics from George Washington University.
More Economy in Brief


