 Global| May 13 2008
U.S. Retail Sales Fell in April, Nonauto Sales Firmer
by:Tom Moeller
|in:Economy in Brief
Summary
U.S. retail sales fell an expected 0.2% last month after an unrevised 0.2% March increase. These latest two months' sales point up the recent weakness in consumer spending. The April sales level was down 0.8% from its peak last [...]
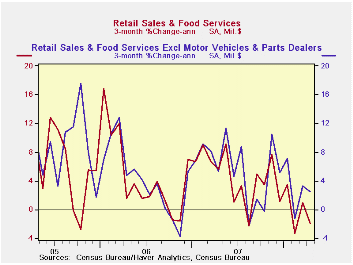
U.S. retail sales fell an expected 0.2% last month after an unrevised 0.2% March increase. These latest two months' sales point up the recent weakness in consumer spending. The April sales level was down 0.8% from its peak last November. On a three month basis overall retail sales were down 2.0% (AR).
Lower sales of motor vehicles & parts account for much
of that weakness. A 2.8% (-7.3% y/y) April decline was the sixth drop
in the last seven months and it mirrored the 4.3% m/m decline in unit
vehicle sales last month.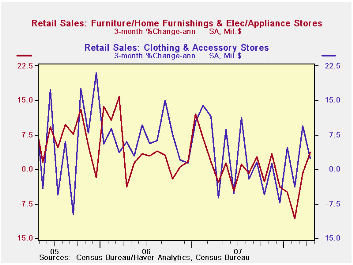
Retail sales excluding autos rose 0.5% and the rise exceeded expectations for a 0.2% gain. That gain followed a revised 0.4% March increase which was revised up from the 0.2% advance reported initially.
Lower sales at gasoline service stations also accounted for
some of last month's weakness in overall retail spending. They fell
0.4% (+16.3% y/y) after a 1.6% March jump. The sales decline occurred
as the pump price of gasoline rose 6.6% m/m. Retail sales less
gasoline & autos rose 0.6% (2.8% y/y) after a 0.2% March gain
that was revised up from no change. On a three month basis these sales
improved to a 3.2% rate of growth from a low of -1.0% this past
February.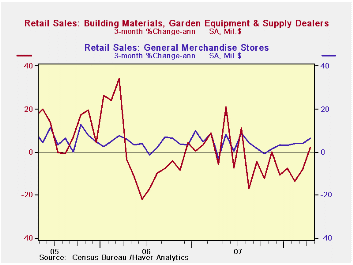
Sales of discretionary items improved. Furniture, home furnishings & appliance store sales finally rose, by 0.8% (-0.8% y/y) after four consecutive months of flat or lower sales. The gain was due to a 1.4% (4.0% y/y) jump in sales of electronics & appliances. Sales of furniture & home furnishings continued to languish, however, and ticked up just 0.1% (-5.1% y/y). Apparel store sales rose 0.7% (3.0% y/y) following a similar gain in March that was revised up from a 0.5% decline reported initially. Sales at general merchandise stores rose 0.5% (4.2% y/y) after a 0.1% uptick that was revised up from a sharp 0.6% decline reported last month.
Building materials & garden equipment sales surged 1.9% (-2.0% y/y) and recouped the 1.5% decline during March.
April sales of nonstore retailers (internet & catalogue) fell slightly m/m (+2.4% y/y) after a 0.5% March increase, but that increase was revised down from the 2.1% surge reported initially.
Restaurant and drinking places sales rose 0.9% (4.2% y/y) last month.
Liquidity Provision by the Federal Reserve is today's speech by Federal Reserve Chairman Ben S. Bernanke and it can be found here
| April | March | Y/Y | 2007 | 2006 | 2005 | |
|---|---|---|---|---|---|---|
| Retail Sales & Food Services | -0.2% | 0.2% | 2.0% | 4.0% | 6.2% | 6.6% |
| Excluding Autos | 0.5% | 0.4% | 4.4% | 4.5% | 7.4% | 7.6% |
| Less Gasoline | 0.6% | 0.2% | 2.8% | 4.1% | 6.2% | 6.4% |
by Tom Moeller May 13, 2008
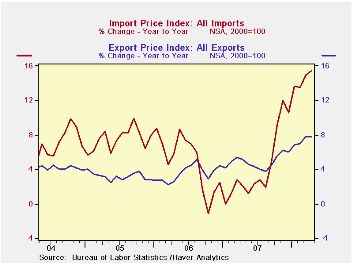
Overall import prices surged last month. The 1.8% gain was right in line with expectations and it followed an even stronger 2.9% surge during March. Together the increases were the strongest on record.
Petroleum prices jumped 4.4% after the 9.2% surge during March. Imported crude petroleum prices already are up another 10% this month versus April.
Less petroleum, import prices increased 1.1%, the same as during March. These increases were the largest on record, pushed higher by the lower foreign exchange value of the dollar.
During the last ten years there has been a 66% (negative) correlation between the nominal trade-weighted exchange value of the US dollar vs. major currencies and the y/y change in non oil import prices. The correlation is a reduced 47% against a broader basket of currencies.
Excluding
petroleum, prices
for
industrial supplies & materials surged another 3.3% (17.0% y/y)
which was the same as the spike during March. These prices are up 11.7%
year to date due to strength in finished metal, chemicals and
agricultural prices. The detailed import price series can be found in
the Haver USINT database. 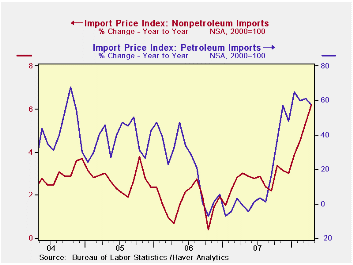
Capital goods import prices rose 0.8% (2.1% y/y) last month but less the lower prices of computers, capital goods prices rose 1.1% (4.4% y/y), the fastest rate of annual gain since 1995. Prices of computers, peripherals and accessories fell 0.3% (-3.8% y/y).
Finally, prices for nonauto consumer goods imports rose 0.2% (2.8% y/y) after two months of 0.4% increase. The y/y increase was the quickest since 1992. Price gains were notably strong for apparel and household goods.
The increase in total export prices eased to just 0.3% after three consecutive months of increase above 1.0%. Agricultural prices fell 2.2% (+32.3% y/y) but nonagricultural export prices rose 0.6% (5.6% y/y).
Globalization and Monetary Policy is today's speech by Cleveland Fed Bank President Sandra Pianalto and it can be found here.
| Import/Export Prices (NSA) | April | March | Y/Y | 2007 | 2006 | 2005 |
|---|---|---|---|---|---|---|
| Import - All Commodities | 1.8% | 2.9% | 15.4% | 4.2% | 4.9% | 7.5% |
| Petroleum | 4.4% | 9.2% | 57.2% | 11.6% | 20.6% | 37.6% |
| Non-petroleum | 1.1% | 1.1% | 6.2% | 2.7% | 1.7% | 2.7% |
| Export- All Commodities | 0.3% | 1.5% | 7.7% | 4.9% | 3.6% | 3.2% |
by Tom Moeller May 13, 2008
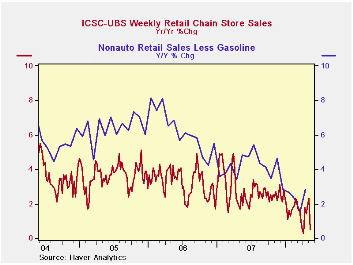
The International Council of Shopping Centers reported that chain store sales fell 1.0% last week after the prior period's 0.2% dip.
During all of April, sales rose 1.0% from March and they began May down 0.1%.
During the last ten years there has been a 45% correlation between the y/y change in chain store sales and the change in nonauto retail sales less gasoline.
The ICSC-UBS retail chain-store sales index is constructed using the same-store sales (stores open for one year) reported by 78 stores of seven retailers: Dayton Hudson, Federated, Kmart, May, J.C. Penney, Sears and Wal-Mart.
During the latest week, the leading indicator of chain store sales from ICSC-UBS rose 0.2% (-3.9% y/y) and it has been declining steadily for more than a year.
The chain store sales figures are available in Haver's SURVEYW database.
| ICSC-UBS (SA, 1977=100) | 05/09/08 | 05/02/08 | Y/Y | 2007 | 2006 | 2005 |
|---|---|---|---|---|---|---|
| Total Weekly Chain Store Sales | 490.3 | 495.4 | 0.5% | 2.8% | 3.3% | 3.6% |
by Louise Curley May 13, 2008
Rising inflation has constrained the Bank of England's monetary policy in its attempt to lower rates to stimulate the slowing economy. After cutting its policy rate from 5.75% to 5.00% on April 10, it held the rate steady on May 8, largely because of inflation. The next meeting of the Monetary Policy Committee will be on June 8. Since May 8, inflation has worsened and the economy continues to slow.
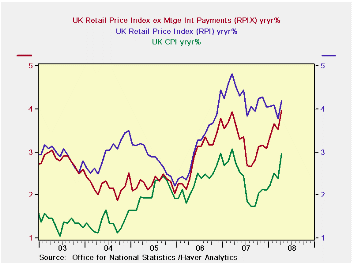
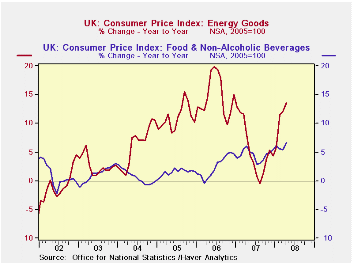
From 2.4% in March inflation in April rose to 3.0%, just within the bounds of the Bank's target (2.0% + or - 1%). The Retail Price Index (RPI), which is used in wage negotiation rose to 4.2% from 3.8% in March and the Retail Price Index excluding mortgage interest payments (RPIX) rose from 3.5% in March to 4.0%in April. The RPIX was the official inflation measure until 2003. The three inflation measures are shown in the first chart. As is the case world wide, it is food and energy costs that account for the spurt in inflation in the UK as can be seen in the second chart.
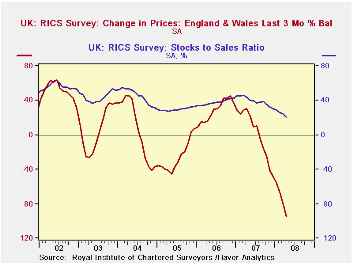
The release today of the Royal Institute of Chartered Surveyors (RICS) Housing Market Survey adds to the growing evidence of a continued slowing of the economy. The percentage of surveyors experiencing lower prices in the last three months was 95.1% greater than those experiencing higher prices. This was the largest negative balance of the entire series beginning in January, 1978. Moreover, the ratio of sales to stocks of the surveyors was also at an all time low of 21.1% as can be seen in the third chart.
| UK INFLATION | Apr 08 | Mar 08 | Feb 08 | Jan 08 | 2007 | 2006 | 2005 |
|---|---|---|---|---|---|---|---|
| Consumer Price Index (CPI) | 3.0 | 2.4 | 2.5 | 2.2 | 2.3 | 2.3 | 2.1 |
| Food | 6.6 | 5.5 | 5.6 | 6.1 | 4.5 | 2.5 | 1.5 |
| Energy | 13.6 | 12.1 | 11.4 | 5.8 | 5.4 | 14.7 | 11.0 |
| Retail Price Index (RPI) | 4.2 | 3.8 | 4.1 | 4.1 | 4.3 | 3.2 | 2.8 |
| RPI ex mtge. int. paymts (RPIX) | 4.0 | 3.5 | 3.6 | 3.4 | 3.2 | 2.9 | 2.3 |
| ROYAL INST. OF CHARTERED SURVEYORS (RICS) | |||||||
| House Price Change Last 3 Mo % balance | -95.1 | -79.4 | -66.2 | -55.0 | 1.7 | 28.3 | -25.9 |
| Ratio: Sales to Stocks % | 21.1 | 24.6 | 26.1 | 28.6 | 38.3 | 37.7 | 29.7 |

Tom Moeller
AuthorMore in Author Profile »Prior to joining Haver Analytics in 2000, Mr. Moeller worked as the Economist at Chancellor Capital Management from 1985 to 1999. There, he developed comprehensive economic forecasts and interpreted economic data for equity and fixed income portfolio managers. Also at Chancellor, Mr. Moeller worked as an equity analyst and was responsible for researching and rating companies in the economically sensitive automobile and housing industries for investment in Chancellor’s equity portfolio. Prior to joining Chancellor, Mr. Moeller was an Economist at Citibank from 1979 to 1984. He also analyzed pricing behavior in the metals industry for the Council on Wage and Price Stability in Washington, D.C. In 1999, Mr. Moeller received the award for most accurate forecast from the Forecasters' Club of New York. From 1990 to 1992 he was President of the New York Association for Business Economists. Mr. Moeller earned an M.B.A. in Finance from Fordham University, where he graduated in 1987. He holds a Bachelor of Arts in Economics from George Washington University.
More Economy in Brief


