 Global| Feb 14 2007
U.S. Retail Sales Eased After Firmed December
by:Tom Moeller
|in:Economy in Brief
Summary
In January, US retail sales slipped marginally after a December gain that was revised up to 1.2% from 0.9% reported initially. The figure for last month fell short of Consensus expectations for a modest 0.3% rise. Excluding autos, [...]
In January, US retail sales slipped marginally after a December gain that was revised up to 1.2% from 0.9% reported initially. The figure for last month fell short of Consensus expectations for a modest 0.3% rise.
Excluding autos, retail sales added 0.3% to an upwardly revised 1.3% December gain, revised from 1.0%.
Sales by motor vehicle & parts dealers reversed all of the December increase with a 1.3% (-1.7% y/y) decline, helped by a 0.1% slip in new unit vehicle sales.
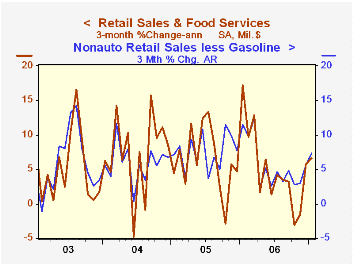
Gasoline service station sales fell 0.7% after the 3.6% jump during December reflecting the 3.2% drop in gasoline prices to an average $2.24 per gallon.Nonauto retail sales less gasoline rose 0.5% (4.3% y/y) last month after an upwardly revised 1.0% spurt during December.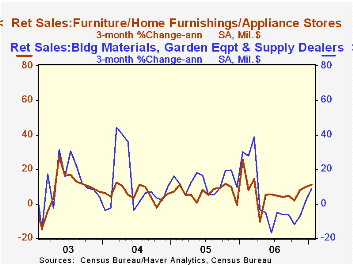
Sales of discretionary items were generally firm last month. Sales at general merchandise stores rose 1.3% (5.6% y/y) after an upwardly revised 1.2% December increase.Apparel store sales also were firm with a 1.0% (4.6% y/y) after a December spurt that was about doubled to 1.1%. Furniture, home furnishings & appliance stores, however, slipped after a December increase that was halved to 0.8%. The huge December gain in sales at electronics & appliance stores was lowered to 1.8% from 3.0%, then sales fell 1.2% last month.
Building material sales rose 0.8% (-3.1% y/y) after a very much upwardly revised 0.7% December increase. Sales of nonstore retailers (internet & catalogue) rose a moderate 0.5% (8.4% y/y) but restaurant and bar sales fell 0.7% (5.3% y/y) after a firm December gain that was upwardly revised a 3.1%.
Chairman Ben S. Bernanke's Senate Testimony, The Semiannual Monetary Policy Report to the Congress, can be found here.
| January | December | Y/Y | 2006 | 2005 | 2004 | |
|---|---|---|---|---|---|---|
| Retail Sales & Food Services | -0.0% | 1.2% | 2.3% | 6.3% | 7.2% | 6.2% |
| Excluding Autos | 0.3% | 1.3% | 3.4% | 7.5% | 8.3% | 7.2% |
by Tom Moeller February 14, 2007
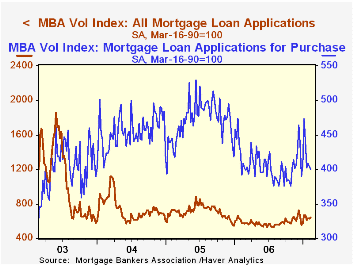
The total number of mortgage applications increased 1.5% last week after a slight 0.2% decline to start the month, according to the Mortgage Bankers Association.
The gain was wholly due to a 4.5% rise in applications to refinance after the 0.2% uptick during the prior week.
Purchase applications fell 1.0% after a 0.8% decline during the prior week.
During the last ten years there has been a 58% correlation between the y/y change in purchase applications and the change in new plus existing single family home sales.
The effective interest rate on a conventional 30-year mortgage ticked up two basis points to 6.46%. Rates averaged 6.40% last month and 6.28% in December. The peak for 30 year financing was 7.08% late in June. Rates for 15-year financing dipped slightly to 6.22%. Interest rates on 15 and 30 year mortgages are closely correlated (>90%) with the rate on 10 year Treasury securities.
During the last ten years there has been a (negative) 79% correlation between the level of applications for purchase and the effective interest rate on a 30-year mortgage.
The Mortgage Bankers Association surveys between 20 to 35 of the top lenders in the U.S. housing industry to derive its refinance, purchase and market indexes. The weekly survey covers roughly 50% of all U.S. residential mortgage applications processed each week by mortgage banks, commercial banks and thrifts. Visit the Mortgage Bankers Association site here.
Monetary Policy Inertia and Recent Fed Actions from the Federal Reserve Bank of San Francisco is available here.
| MBA Mortgage Applications (3/16/90=100) | 02/09/07 | 02/02/07 | Y/Y | 2006 | 2005 | 2004 |
|---|---|---|---|---|---|---|
| Total Market Index | 639.8 | 630.1 | 11.4% | 584.2 | 708.6 | 735.1 |
| Purchase | 400.7 | 404.7 | 2.3% | 406.9 | 470.9 | 454.5 |
| Refinancing | 2,031.7 | 1,943.4 | 24.1% | 1,634.0 | 2,092.3 | 2,366.8 |
by Carol Stone February 14, 2007
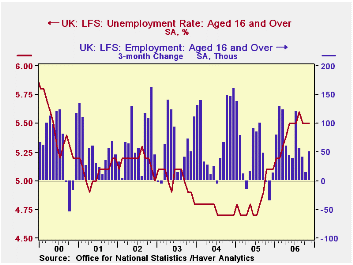
Employment in the UK rose 7,000 in the November period, a third successive monthly increase in this 3-month moving average. Over the last three months (the style of comparison that the UK's Office for National Statistics [ONS] generally emphasizes) employment went up by 50,000. The advances were more than accounted for among part-time workers, who increased 80,000 over three months ago, in contrast to a 30,000 decline in full-time workers.
The unemployment rate has held flat at 5.5% since September, and is 0.1% below its August reading. This resulted from an outright decrease in the number unemployed of 24,000 since August, helped by the increase in employment and also by a smaller gain in the number of people "in economic activity" (what the US calls the "labor force"), 26,000, than in the total population over age 16, 92,000. This cut the ratio of the labor force to the population from 63.7% in the August period to 63.6% in November.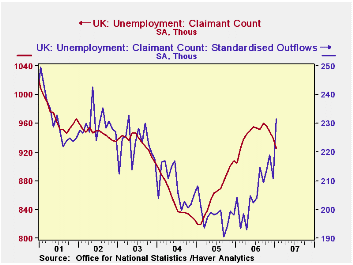
The UK's alternative unemployment measure, the "claimant count", shows more unambiguous improvement, albeit modestly so; the number of claimants (similar to the US measure of the number of people receiving unemployment insurance) fell 9,300 in December and 13,500 in January. The resulting "claimant rate" was 2.9% in January, down from 3.0% for the previous 10 consecutive months. "Inflows" to this group have had a choppy, but trendless pattern in recent months, while the number of "outflows" has increased consistently over almost the past year, suggesting increased hiring of benefit recipients.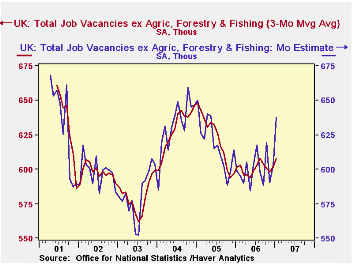
An increase in job vacancies in January hints that the recent hesitant but favorable labor market trend might continue. For January alone, vacancies were 637,700, up almost 35,000 from December. This put them at their highest level since the spring of 2005. The 3-month moving average rose slightly to 607,900, about even with last August and still well below the early-2005 amounts. So signs of improvement remain tentative, but the marginal adjustments in the labor market, new hires and vacancies, show a potential for further advance.
| UK Labor Force Survey & Related Labor Data | Jan 2007 | Dec 2006 | Nov 2006 | Oct 2006 | Year Ago | 2006 | 2005 | 2004 |
|---|---|---|---|---|---|---|---|---|
| Employment* (3Mo Avg, SA, Thous) |
-- | -- | 29,036 | 29,029 | 28,758 | 28,960 | 28,730 | 28,465 |
| Chg from 1 & 3 Months Ago | -- | -- | +7/50 | +24/14 | +23 (MoAvg)1% y/y | 0.8% | 0.9% | 1.0% |
| Unemployment Rate* (3Mo Avg, SA, %) |
-- | -- | 5.5% | 5.5% | 5.1% | 5.4% | 4.8% | 4.8% |
| Claimant Count (Monthly, Thous) |
925.8 | 939.3 | 948.6 | 956.5 | 905.1 | 944.1 | 861.8 | 853.5 |
| Vacancies (Monthly, Thous) | 637.7 | 602.8 | 590.7 | 619.1 | 598.8 | 599.4 | 618.6 | 631.9 |

Tom Moeller
AuthorMore in Author Profile »Prior to joining Haver Analytics in 2000, Mr. Moeller worked as the Economist at Chancellor Capital Management from 1985 to 1999. There, he developed comprehensive economic forecasts and interpreted economic data for equity and fixed income portfolio managers. Also at Chancellor, Mr. Moeller worked as an equity analyst and was responsible for researching and rating companies in the economically sensitive automobile and housing industries for investment in Chancellor’s equity portfolio. Prior to joining Chancellor, Mr. Moeller was an Economist at Citibank from 1979 to 1984. He also analyzed pricing behavior in the metals industry for the Council on Wage and Price Stability in Washington, D.C. In 1999, Mr. Moeller received the award for most accurate forecast from the Forecasters' Club of New York. From 1990 to 1992 he was President of the New York Association for Business Economists. Mr. Moeller earned an M.B.A. in Finance from Fordham University, where he graduated in 1987. He holds a Bachelor of Arts in Economics from George Washington University.


