 Global| Sep 14 2005
U.S. Retail Sales Down With Autos, Elsewhere OK
by:Tom Moeller
|in:Economy in Brief
Summary
US retail sales fell 2.1% in August due to a 12.0% drop in motor vehicle dealers' sales. Consensus expectations had been for a 1.3% decline. Less autos, however, retail sales doubled expectations and rose 1.0%. Some of this m/m [...]
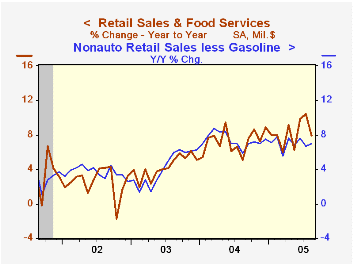
US retail sales fell 2.1% in August due to a 12.0% drop in motor vehicle dealers' sales. Consensus expectations had been for a 1.3% decline. Less autos, however, retail sales doubled expectations and rose 1.0%.
Some of this m/m strength was due to a 4.4% surge in gasoline service station sales, although it was just half the 8.6% m/m increase in the retail price of gasoline to an average $2.49 per gallon.
Less gasoline, nonauto retail sales rebounded 0.5% (7.0 y/y) following no change in July.
Sales at furniture & electronics stores rose 0.6% (5.9% y/y) following an upwardly revised 0.2% July increase. Sales of nonstore retailers (internet & catalogue) jumped 1.8% (11.0% y/y) and sales of building materials rose 0.5% (8.4% y/y).
On the disappointing side, general merchandise store sales rose a modest 0.3% (6.7% y/y) after downwardly revised gains in both July and June while apparel store sales were unchanged after a deepened 0.9% drop in July.
Oil Prices and Consumer Spending from the Federal Reserve Bank of Richmond is available here.
| Aug | July | Y/Y | 2004 | 2003 | 2002 | |
|---|---|---|---|---|---|---|
| Retail Sales & Food Services | -2.1% | 1.9% | 7.9% | 7.3% | 4.3% | 2.5% |
| Excluding Autos | 1.0% | 0.5% | 9.4% | 8.3% | 4.7% | 3.3% |
by Tom Moeller September 14, 2005
Industrial output in August rose 0.1% for the second consecutive month and fell short of Consensus expectations for a 0.3% increase. The disappointment centered on declines in utility output (-0.5%) and mining output (-0.7%). Factory sector production rose 0.3% (2.9% y/y) but the July increase was revised down to just 0.1%.
Hurricane Katrina lowered the gain in output by 0.3 percentage points.
A 3.8% (5.5% y/y) rise in motor vehicle & parts production accounted for all of last month's output gain. Less motor vehicles, factory output was unchanged (2.6% y/y) following an unrevised 0.3% July increase.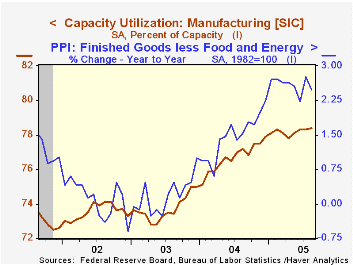
Output of computers & peripheral equipment jumped another 1.5% (19.4% y/y) after the huge 2.3% spike in July. Excluding the high tech sector as well as autos, factory output fell 0.1% (+1.6% y/y).
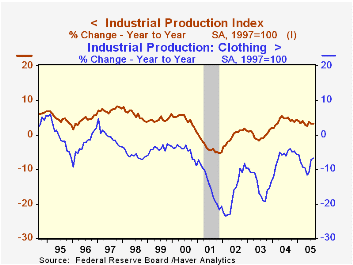
Output of appliances, furniture & carpeting rose 0.7% (1.0% y/y) and recovered a 0.8% drop in July although output of nondurable goods doubled the prior month's decline and fell 0.6% (+2.4% y/y). U.S. clothing output has fallen nearly two thirds from what is was ten years ago (-6.7% y/y) and, during the last three months, paper products' output is down as well (+3.4% y/y).
Total capacity utilization was stable at 79.8% and capacity grew 1.1% y/y. Factory sector utilization rose to 78.4%, up from 77.2% last August while capacity rose 1.4% y/y.
Pricing, Production and Persistence from the Federal Reserve Bank of Philadelphia can be found here.
| Production & Capacity | Aug | July | Y/Y | 2004 | 2003 | 2002 |
|---|---|---|---|---|---|---|
| Industrial Production | 0.1% | 0.1% | 3.2% | 4.1% | -0.0% | -0.3% |
| Consumer Goods | 0.4% | -0.5% | 2.4% | 2.7% | 0.3% | 1.4% |
| Business Equipment | -0.2% | 1.6% | 8.0% | 9.5% | 1.2% | -7.9% |
| Capacity Utilization | 79.8% | 79.8% | 78.3% (8/04) | 78.1% | 75.5% | 75.3% |
by Tom Moeller September 14, 2005
In August, the U.S. federal government ran a budget deficit of $50.0B. That was slightly deeper than Consensus estimates but it was quite a bit deeper than a $41.1BB deficit last August. Nevertheless, the deficit of $352.6B during the first eleven months of FY 2005 was 19% lower than the prior fiscal year's first eleven months.
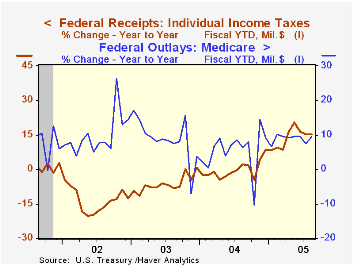
Overall, U.S. net outlays grew 6.8% during the first eleven months of FY05. A 20.3% y/y gain in federal outlays on defense (19% of total outlays) counted for much of the deterioration in the deficit picture versus last August. That rise lifted defense spending by 7.3% in fiscal year 2005 versus 2004. Medicare spending (12% of total outlays) also popped 29.6% versus August of 2004 and FYTD growth accelerated to 9.4%. Growth in spending on social security (21% of total outlays) was about stable at 5.6% though spending on health programs (10% of the total) picked up a bit to 4.4%. Spending on education & training (4% of the total) surged 51% versus last August and grew 15.3% FYTD while interest expense (8% of the total) grew 11.7% with higher interest rates versus declines last year.
Net receipt growth at 13.7% during the first eleven months of FY05 continued to reflect the improved economy. Individual income taxes (44% of total receipts) rose 15.3% and corporate income taxes (10% of total receipts) rose 41.3%. The improved job market raised employment taxes (36% of total receipts) by 8.1%.
Do Productivity Growth, Budget Deficits, and Monetary Policy Actions Affect Real Interest Rates? Evidence From Macroeconomic Announcement Data from the Federal Reserve Bank of St. Louis is available here.
| US Government Finance | Aug | July | FY '05 - YTD | FY2004 | FY2003 | FY2002 |
|---|---|---|---|---|---|---|
| Budget Balance | $-50.0B | $52.8B | $-352.6B | $-412.1B | $-377.6B | $-157.8B |
| Net Revenues | $155.4B | $142.1B | 13.7% | 5.5% | -3.8% | -6.9% |
| Net Outlays | $205.4B | $194.9B | 6.8% | 6.1% | 7.4% | 7.9% |
by Carol Stone September 14, 2005
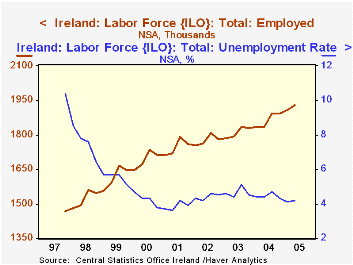
As we monitor large economies around the world, it's easy to lose track of their smaller neighbors. Ireland's Central Statistics Office reported employment and unemployment data this morning for Q2. The labor market there is strong and undergoing an interesting structural shift.
Employment shot up in Q2 by 20,900 from Q1, producing a 93,000 increase from Q2 a year ago, a substantial 5.1% growth rate. In comparison, employment in the UK, which was reported today for the three months centered on June, grew by 1.11% year-on-year, and that was the fastest rate since last November (the three months centered on November), when it was just marginally higher, 1.14%. Further for Ireland, whose data are not seasonally adjusted, the increase was also the biggest for Q2 over Q1 in five years, since 2000. 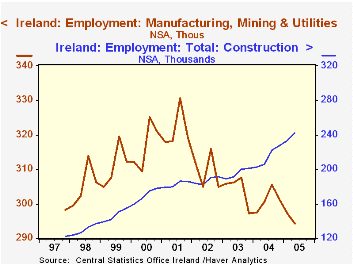
The Irish unemployment rate rose very modestly from 4.1% in Q1 to 4.2% in Q2. Even so, these two quarters have the lowest six-month average rate since 2001. The rate peaked at 5.1% in Q3 2003. Impressively, the low unemployment is being maintained at high levels of labor force participation. The participation rate reached 61.5% in Q2, a record for Q2, and 1.5 percentage points above Q2 2004.
One might think of Ireland as a manufacturing-centered country, but it, as others, has seen that sector diminish. Factory jobs fell to 294,200 in Q2, the first Q2 figure below 300,000 in the eight-year history of the series and down from a peak of 330,700 in Q3 2001. Notably, though, "industry" as a whole has held steady as construction jobs have taken up the slack. Services are responsible for the firm overall growth in jobs, with several individual sectors advancing steadily -- finance, education and health care, most notably.
| Ireland Not Seasonally Adjusted |
Q2 2005 | Q1 2005 | Q2 2004 | 2004 | 2003 | 2002 |
|---|---|---|---|---|---|---|
| Employment (thousands) | 1929.2 | 1908.3 | 1836.2 | 1865.0 | 1810.6 | 1777.0 |
| Yr/Yr %Chg | 5.1 | 3.9 | 2.4 | 3.0 | 1.9 | 1.8 |
| Unemployment Rate (%) | 4.2 | 4.1 | 4.4 | 4.5 | 4.7 | 4.4 |
| Participation Rate (%) | 61.5 | 61.0 | 60.0 | 60.7 | 50.1 | 60.0 |

Tom Moeller
AuthorMore in Author Profile »Prior to joining Haver Analytics in 2000, Mr. Moeller worked as the Economist at Chancellor Capital Management from 1985 to 1999. There, he developed comprehensive economic forecasts and interpreted economic data for equity and fixed income portfolio managers. Also at Chancellor, Mr. Moeller worked as an equity analyst and was responsible for researching and rating companies in the economically sensitive automobile and housing industries for investment in Chancellor’s equity portfolio. Prior to joining Chancellor, Mr. Moeller was an Economist at Citibank from 1979 to 1984. He also analyzed pricing behavior in the metals industry for the Council on Wage and Price Stability in Washington, D.C. In 1999, Mr. Moeller received the award for most accurate forecast from the Forecasters' Club of New York. From 1990 to 1992 he was President of the New York Association for Business Economists. Mr. Moeller earned an M.B.A. in Finance from Fordham University, where he graduated in 1987. He holds a Bachelor of Arts in Economics from George Washington University.
More Economy in Brief


