 Global| Aug 11 2005
U.S. Retail Sales Disappoint
by:Tom Moeller
|in:Economy in Brief
Summary
US retail sales jumped another 1.8% last month, about matching Consensus expectations, following a similar gain in June that was little revised. The figure was a disappointment, however, because without autos and gasoline sales last [...]
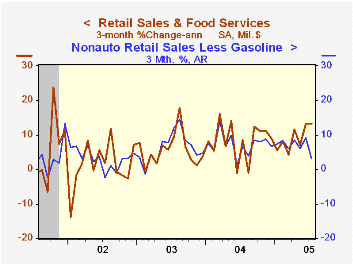
US retail sales jumped another 1.8% last month, about matching Consensus expectations, following a similar gain in June that was little revised. The figure was a disappointment, however, because without autos and gasoline sales last month were unchanged after increasing 0.7% in June, revised up from 0.6%.
Motor vehicle & parts dealers' sales jumped 6.7% (17.9% y/y) as successful price discounting programs lifted unit sales 19.0% m/m to a 20.9M selling rate.
Sales at gasoline service stations added 2.4% (20.3% y/y) to the 2.0% rise in June as gasoline prices jumped 6.2% m/m to an average $2.29 per gallon.
Sales at furniture & electronics stores gave back 0.2% (3.9% y/y) of a 1.3% June surge which was double the rise estimated initially. General merchandise store sales also took a breadth and were unchanged following a 1.3% (7.0% y/y) June surge that was little revised. Falling 0.5% (+6.9% y/y), apparel store sales retraced about half of the prior month's 1.1% increase.
Building material store sales fell 0.4% (8.4% y/y) following two months of 0.3% increase.
Sales of nonstore retailers (internet and catalogue) slipped 0.1% (+11.3% y/y) after a 2.7% jump in June that was revised up sharply.
| July | June | Y/Y | 2004 | 2003 | 2002 | |
|---|---|---|---|---|---|---|
| Retail Sales & Food Services | 1.8% | 1.7% | 10.3% | 7.2% | 4.3% | 2.5% |
| Excluding Autos | 0.3% | 0.9% | 8.1% | 8.3% | 4.7% | 3.3% |
by Tom Moeller August 11, 2005
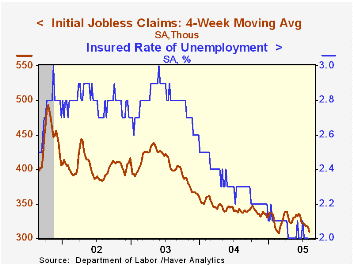
Initial claims for unemployment insurance reversed all of the prior week's little revised up tick and fell 6,000 to 308,000. Consensus expectations for 315,000 claims.
The four week moving average of initial claims declined to 309,250 (-9.0% y/y), the lowest level since mid-February.
Continuing claims for unemployment insurance fell 8,000 following a deepened 22,000 decline one week earlier.
During the last ten years there has been a (negative) 75% correlation between the level of initial claims for unemployment insurance and the monthly change in payroll employment. There has been a (negative) 65% correlation with the level of continuing claims.
The insured unemployment rate remained at the four year low of 2.0% for the fourth consecutive week.
| Unemployment Insurance (000s) | 08/06/05 | 07/30/05 | Y/Y | 2004 | 2003 | 2002 |
|---|---|---|---|---|---|---|
| Initial Claims | 308 | 314 | -7.5% | 343 | 402 | 404 |
| Continuing Claims | -- | 2,573 | -10.5% | 2,926 | 3,531 | 3,570 |
by Tom Moeller August 11, 2005
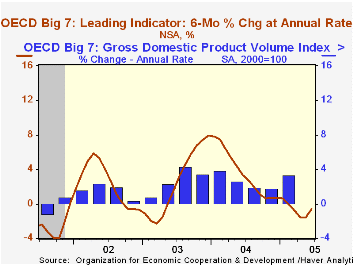
The Leading Index of the Major 7 OECD economies rose in June by 0.5%, the first m/m increase this year. Six month growth in the index also improved to -0.6% from -1.6% during the prior two months.
During the last ten years there has been a 69% correlation between the change in the leading index and the q/q change in the GDP Volume Index for the Big Seven countries in the OECD.
Improvement was led by a 0.9% gain in the US leaders. This second consecutive monthly increase raised six month growth to 1.0%, the first positive reading since February. The Canadian leaders also were firm and rose 0.6%, raising six month growth to -1.7% from a recent low of -3.7%.
Leaders in the European Union (15 countries) managed a 0.1% increase following six consecutive months of decline. Six month growth remained negative at -0.3%.
German leaders rose for the second consecutive month. A 0.5% increase raised six month growth to -0.4%. The French leaders also rose by 0.3% but six month growth remained a negative 1.1%. The Italian leading index continued to decline. The 0.7% drop lowered six month growth to -3.3%, its worst 2001.
The UK leaders rose 0.1% after seven months of decline and six month growth remained negative at -0.9%. Japan leaders ticked up 0.2% This first increase of the year left six growth negative at -2.6%.
The latest OECD Leading Indicator report is available here.
| OECD | June | May | Y/Y | 2004 | 2003 | 2002 |
|---|---|---|---|---|---|---|
| Composite Leading Index | 101.63 | 101.14 | -0.4% | 102.02 | 97.55 | 96.34 |
| 6 Month Growth Rate | -0.6% | -1.6% | 3.5% | 2.5% | 2.3% |
by Tom Moeller August 11, 2005
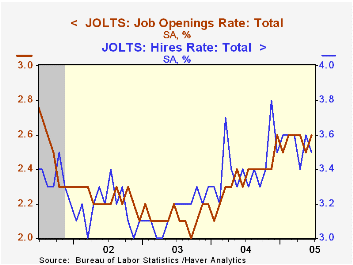
The Bureau of Labor Statistics reported that the job openings rate, from the Job Openings & Labor Turnover Survey (JOLTS), improved in June versus May to 2.6%, but 2.6% has been the average so far this year. The job openings rate is the number of job openings on the last business day of the month as a percent of total employment plus job openings. The total number of job openings, however, reversed most of the prior month's decline and rose 3.7% (12.8% y/y).
The hires rate dipped slightly to 3.5% from an upwardly revised 3.6% in May. The hires rate is the number of hires during the month divided by employment.
The job separations rate fell to 3.3% after having been elevated during the prior three months. Total separations include quits, layoffs, discharges, and other separations as well as retirements. The total separations, or turnover, rate is the total number of separations during the month divided by employment.
The survey dates only to December 2000 but has since followed the movement in nonfarm payrolls.
A description of the Jolts survey and the latest release from the U.S. Department of Labor is available here.
| JOLTS (Job Openings & Labor Turnover Survey) | June | May | June '04 | 2004 | 2003 | 2002 |
|---|---|---|---|---|---|---|
| Job Openings Rate: Total | 2.6% | 2.5% | 2.3% | 2.4% | 2.1% | 2.2% |
| Hires Rate: Total | 3.5% | 3.6% | 3.4% | 3.4% | 3.2% | 3.2% |
by Tom Moeller August 11, 2005
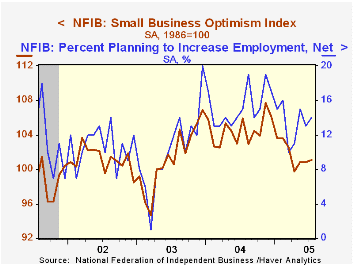
The Small Business Optimism Index reported by the National Federation of Independent Business (NFIB) rose a slight 0.3% in July following no change the month prior.
During the last ten years there has been a 64% correlation between the level of the NFIB index and the two quarter change in real GDP.
The slight rise reflected a reversal of the prior month's contradictory indications. In July a greater percentage of firms expected higher real sales in six months and a lower percentage expected the economy to improve.
The job outlook improved as the percentage of firms planning to raise employment recovered half of the prior month's decline an continued an up trend in place since April. The percentage of firms with one or more job openings also rose slightly. During the last ten years there has been a 67% correlation between hiring plans and the three month growth in nonfarm payrolls.
The percentage of firms planning to raise capital spending fell as did the percentage of firms raising average selling prices rose.
About 24 million businesses exist in the United States. Small business creates 80% of all new jobs in America.
| Nat'l Federation of Independent Business | July | June | Y/Y | 2004 | 2003 | 2002 |
|---|---|---|---|---|---|---|
| Small Business Optimism Index (1986=100) | 101.1 | 100.8 | -4.5% | 104.6 | 101.3 | 101.2 |
by Tom Moeller August 11, 2005
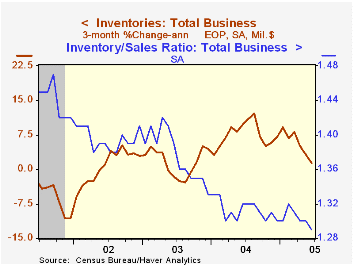
Total business inventories were unchanged in June following an unrevised 0.1% gain in May. The weakness in accumulation lowered the three month change in inventories to 1.4% (AR) versus a 12.1% peak rate of accumulation through last August. The ratio of inventories-to-sales dropped to a new record low of 1.29 as business sales rose 0.7% (7.8% y/y).
Retail inventories fell 0.4% due to strong auto sales in June and the three month change went slightly negative versus the peak of 12.4% last April. Excluding autos, however, retail inventories jumped 0.6% after an upwardly revised 0.7% May gain. Furniture inventories were again strong, up 1.3% (9.0% y/y) and inventories of apparel rose 0.9% (5.3% y/y).
Factory sector inventories fell slightly for the third consecutive month pulling three month negative for the first time since 2003.
Wholesale inventories jumped 0.7% and three month growth rose to 6.9%. During the last ten years there has been a 64% correlation between the y/y change in wholesale inventories and the change in imports of merchandise.
| Business Inventories | June | May | Y/Y | 2004 | 2003 | 2002 |
|---|---|---|---|---|---|---|
| Total | 0.0% | 0.1% | 5.9% | 7.7% | 1.4% | 1.6% |
| Retail | -0.4% | 0.2% | 2.2% | 5.7% | 3.9% | 5.9% |
| Retail excl. Autos | 0.6% | 0.7% | 6.3% | 5.9% | 2.0% | 2.3% |
| Wholesale | 0.7% | 0.3% | 10.2% | 10.8% | 2.0% | 1.2% |
| Manufacturing | -0.0% | -0.2% | 6.4% | 7.5% | -1.3% | -1.8% |
by Tom Moeller August 11, 2005
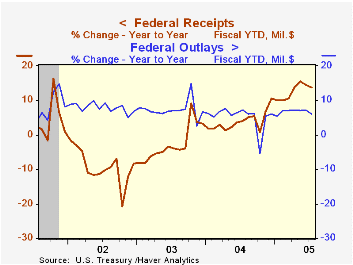
The U.S. federal government budget deficit of $52.8B in July that was somewhat shallower than Consensus estimates. The monthly deficit contrasted with a $69.2B deficit last July and during the first ten months of FY 2005 the deficit remained nearly one quarter lower than the prior fiscal year's first ten months.
Net receipt growth at 13.8% for the first ten months of FY05 continued to reflect the improved economy. Individual income taxes (44% of total receipts) rose 15.1% and corporate income taxes (10% of total receipts) rose 41.7%. The improved job market raised employment taxes (36% of total receipts) by 8.0%.
Federal outlay growth fell to 6.1% during the first ten months of FY05. Defense spending (19% of total outlays) grew 5.6% and Medicare spending (12% of total outlays) slowed to 7.5% growth. Growth in spending on social security (21% of total outlays) was about stable at 5.7% and spending on health programs (10% of the total) also was stable at 4.1%. Spending on education & training (4% of the total) grew 12.0% and interest expense (8% of the total) grew 12.3% with higher interest rates versus declines last year.
The latest from the Congressional Budget Office is available here.
| US Government Finance | July | June | FY '05 - YTD | FY2004 | FY2003 | FY2002 |
|---|---|---|---|---|---|---|
| Budget Balance | $-52.8B | $22.4B | $-302.6B | $-412.1B | $-377.6B | $-157.8B |
| Net Revenues | $142.1B | $243.8B | 13.8% | 5.5% | -3.8% | -6.9% |
| Net Outlays | $194.9B | $212.4B | 6.1% | 6.1% | 7.4% | 7.9% |
by Carol Stone August 11, 2005
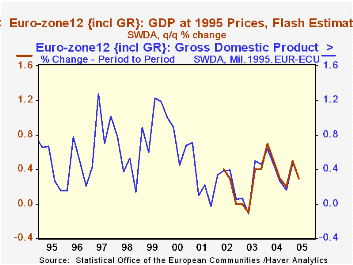
European GDP slowed in Q2, according to the "Flash Estimate" published today by the EC Commission. Growth for the Euro-Zone 12 countries was 0.3%, off from 0.5% in Q1. GDP ran 1.2% ahead of a year ago. At the same time, the EU expects Q3 and Q4 to improve, evidently due to the somewhat weaker euro; the "high" and "low" forecasts average to a 0.4% increase in Q3 and 0.6% in Q4.
The Q2 result is the net of widely varying outcomes among the countries reporting today. The German economy came to a dead stop, with zero change, although this followed a strong 0.8% gain in Q1. Growth over the last year has been 1.5%. Italy and the Netherlands, by contrast, saw Q2 rebounds after weak Q1 numbers. For Italy, this means that the year-on-year change is a mere 0.1%, but the Dutch economy has gained 1.3%. Spain maintained its Q1 pace of 0.9% in Q2 as well, with the year-on-year rate at 3.4%; it continues to sustain a growth trend well above other European economies.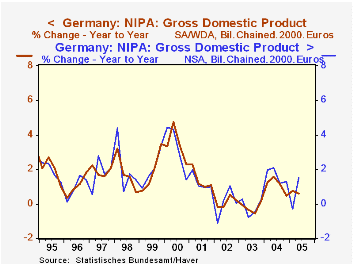
One technical note on the growth rates. In the table below, we show quarter-to-quarter changes based on seasonally adjusted data. But the year-on-year and annual figures come from not seasonally adjusted data. Seasonal adjustment is meant to smooth regular intra-year data movements. The year as a whole, however, should be unaffected by these shorter periodic changes, so the raw data is more appropriate for 12-month comparisons. Further, the calculations can produce different results as the seasonal forces might differ from year to year or the performance of components with varying weights might differ from year to year. A good example is Germany, where the second graph shows that year-on-year percent changes differ throughout, and in the table, the row showing annual growth calculated from seasonally adjusted figures is significantly different for Q2 over Q2 2004 and for 2004 as a whole. The Federal Statistics Office highlights the availability of two more trading days this year as a reason for the Q2 differential. Chain weighting and concurrent seasonal adjustment are two other factors that can increase the differences between the adjusted and unadjusted series in the most recent periods.
| Seasonally Adjusted Not Seasonally Adjusted | ||||||
|---|---|---|---|---|---|---|
| Q2 2005 | Q1 2005 | Year Ago | 2004 | 2003 | 2002 | |
| Euro-Zone 12 | 0.3 | 0.5 | 1.2 | 1.7 | 0.7 | 0.9 |
| Germany | 0.0 | 0.8 | 1.5 | 1.6 | -0.2 | 0.1 |
| Seasonally Adjusted Year | 0.6 | 1.1 | -0.2 | 0.1 | ||
| Italy | 0.7 | -0.5 | 0.1 | 1.0 | 0.4 | 0.4 |
| Spain | 0.9 | 0.9 | 3.4 | 3.1 | 2.9 | 2.7 |
| Netherlands | 1.2 | -0.8 | 1.3 | 1.7 | -0.1 | 0.1 |

Tom Moeller
AuthorMore in Author Profile »Prior to joining Haver Analytics in 2000, Mr. Moeller worked as the Economist at Chancellor Capital Management from 1985 to 1999. There, he developed comprehensive economic forecasts and interpreted economic data for equity and fixed income portfolio managers. Also at Chancellor, Mr. Moeller worked as an equity analyst and was responsible for researching and rating companies in the economically sensitive automobile and housing industries for investment in Chancellor’s equity portfolio. Prior to joining Chancellor, Mr. Moeller was an Economist at Citibank from 1979 to 1984. He also analyzed pricing behavior in the metals industry for the Council on Wage and Price Stability in Washington, D.C. In 1999, Mr. Moeller received the award for most accurate forecast from the Forecasters' Club of New York. From 1990 to 1992 he was President of the New York Association for Business Economists. Mr. Moeller earned an M.B.A. in Finance from Fordham University, where he graduated in 1987. He holds a Bachelor of Arts in Economics from George Washington University.
More Economy in Brief


