 Global| Oct 14 2009
U.S. Retail Sales Decline In September After Auto-Led August Gain; Underlying Trend Firms
by:Tom Moeller
|in:Economy in Brief
Summary
The DIHK survey, a poling of over 25000 firms by the German chambers of industry and commerce, is not conducted in Q3. So the fourth quarters -10 reading compares to the -17 reading from Q2. It is a net balance of opinion diffusion [...]
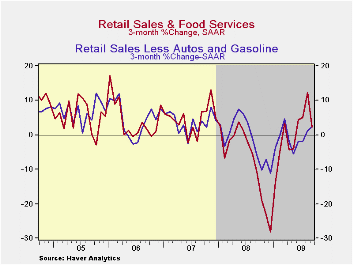 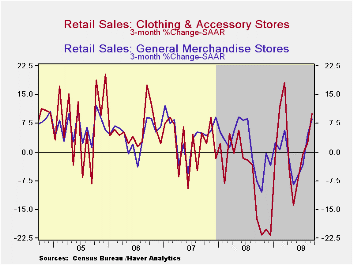 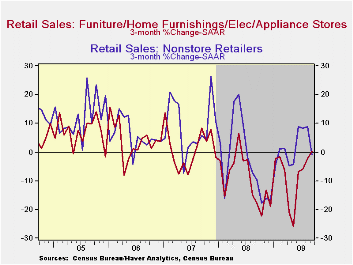 |
| · Without the healthy incentive to buy a new motor vehicle, retail sales last month gave back their August gain. Retail Sales fell 1.5% during September after a 2.2% August increase that was slightly less than reported initially. The retail sales data are available in Haver's USECON database.· The end of the "Cash-For-Clunkers" auto sales program led to a 10.4% drop in retail sales of motor vehicles last month which more than reversed the 7.8% August jump. These dollar figures accompanied the 34.6% m/m drop in unit vehicle sales reported earlier this month which followed a 25.4% August increase.· After accounting for this extreme volatility, sales during the last two months posted fairly steady increases. Without the auto sector, retail sales rose 0.5% after a 1.0% increase during August. Moreover, these gains have suffered little from the recent jump in gasoline prices. Without autos and gasoline, retail sales rose 0.4% (-1.6% y/y) after a 0.6% August increase. These were the first two consecutive monthly increase since January/February '09. The y/y change of -1.5% compares to -4.5% y/y during July. · Discretionary spending firmed last month as sales at general merchandise stores rose 0.9% (1.1% y/y) after a firm 1.2% August increase. In the soft goods area, apparel store sales increased 0.5% (-1.3% y/y) following even firmer increases during the prior two months. Finally, furniture, electronics & appliance store sales rose 0.7% (-8.2% y/y). Furniture store sales alone more-than-reversed an August drop with a 1.4% (-6.5% y/y) jump while sales of electronics & appliances were unchanged (-9.7% y/y).· Internet and catalogue purchases slipped 0.1% (-2.3% y/y) following a 0.1% August uptick. Finally, restaurant sales gained 0.2% (0.6% y/y) after a 0.6% August gain.· Building materials sales continued their slump and fell 0.2% (-13.0% y/y) after larger declines during the prior three months.· Yesterday's speech by Fed Vice chairman Donald L. Kohn on The Economic Outlook can be found here. |
|---|
| September | August | July | Y/Y | 2008 | 2007 | 2006 | |
|---|---|---|---|---|---|---|---|
| Retail Sales & Food Services (%) | -1.5 | 2.2 | -0.1 | -5.7 | -0.7 | 3.3 | 5.3 |
| Excluding Autos | 0.5 | 1.0 | -0.5 | -8.5 | 2.5 | 3.9 | 6.3 |
| Less Gasoline | 0.4 | 0.6 | -0.3 | -1.6 | 1.6 | 3.6 | 5.7 |
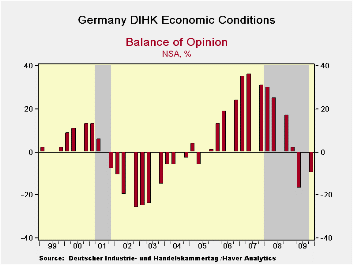
The DIHK survey, a poling of over 25000 firms by the German chambers of industry and commerce, is not conducted in Q3. So the fourth quarter’s -10 reading compares to the -17 reading from Q2. It is a net balance of opinion diffusion index. A strong improvement in existing conditions is indicated, but declines persist. DIHK itself pointed to the role in temporary government stimulus in boosting the survey and muted its optimism with expectations for more modest improvements in the index for the quarter ahead
The index has climbed up from the 14th percentile of its range in 2009-Q2 to stand in the 25th percentile in Q4. Business expectations are sharply higher at a raw reading of zero up from -27 in Q2. The range standing for that reading is up to a respectable 58th percent of the range from a low 13th percentile in Q2. Export expectations are up even more strongly to a raw reading of +7 from a Q2 reading of -37, pushing the percentile standing up to its 55th percentile from 1.3% in 2009 Q2. These sorts of progressions are in line with much of the data that have been reported that have showed foreign orders to be picking up, although some recent German export figures were more disappointing; that slowdown is not corroborated here.
As to investment, the Q2 percentile standing was the worst in the history of the survey, a history that extends back to Q4 1991. The improved standing to a still-weak 27th percentile on a raw reading of -17 nonetheless is sharply up from -30 in Q2. Still we can see that investment demands are lagging. Hiring intentions occupy a sort of middle ground at a raw reading of -15; conditions are much improved from Q2’s reading at -25. Still more cutting is indicated. The percentile standing has been boosted to its 38th percentile, but that is still weak. Clearly much more improvement will bee needed to stoke job growth and just to keep the prospect of more cuts at bay.
| Net Balance Readings | Change | Range Q4'91 | Percentile | |||||
| Q4-09 | Q2-09 | Q1-09 | Yr Ago | 2-Yr | 3-Yr | Q4-09 | Q2-09 | |
| Economic Conditions | -10 | -17 | 2 | -27 | -41 | -34 | 25.8 | 14.5 |
| Business Expectations | 0 | -27 | -35 | 7 | -15 | -10 | 58.3 | 13.3 |
| Export Expectations | 7 | -34 | -35 | -6 | -30 | -27 | 55.3 | 1.3 |
| Investment Intentions | -17 | -30 | -23 | -15 | -31 | -23 | 27.7 | 0.0 |
| Hiring Intentions | -15 | -25 | -20 | -13 | -24 | -15 | 38.3 | 17.0 |
by Bob Brusca October 14, 2009
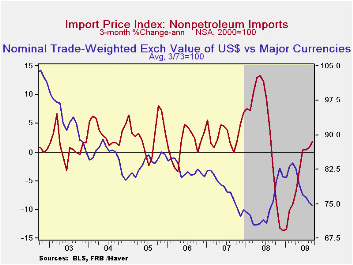
Weakness in the U.S. dollar is pushing up non-oil import prices. Following the strength in oil prices earlier this year, now non-oil prices have firmed. U.S. import prices last month ticked up the expected 0.1% after jumps between 1.0% and 3.0% during three of the prior four months.
The latest report showed that non-oil import prices rose 0.4%, which was the strongest monthly increase since July of last year. On a three-month basis, these prices have risen at a 1.9% annual rate after declining at a 13.6% rate as of last December. (During the last ten years, there has been a negative 81% correlation between the nominal trade-weighted exchange value of the US dollar vs. major currencies and the y/y change in non-oil import prices.)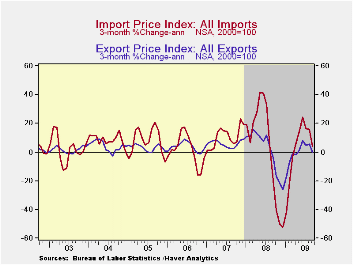
Import prices break down as follows: Food prices added 0.4% to a 1.3% August increase (-5.0% y/y). Capital goods prices broke from weakness with a 0.1% uptick which raised the three-month change to 0.4% following a 3.4% rate of decline in June. Prices for nonauto consumer goods also rose 0.1% (-1.0% y/y) and brought the three-month change to -1.1% from its weakest reading of -2.6% in January. Durable consumer goods prices were unchanged (-1.4% y/y) after two months of slight decline. Household goods rose slightly (-1.6% y/y) and furniture prices jumped 0.9% (-1.0% y/y). Apparel prices were unchanged for the second month (-1.1% y/y) but the three-month change improved to -0.4% from -4.3% six months ago.
The recent gain in petroleum prices took a breather last month and fell 1.1% after sharp increases during six of the prior seven months. This month, however, crude oil prices have found renewed strength and were up to $74.15 per barrel yesterday from a September average of $69.46.
Total export prices reversed some of their earlier strengthening with a fall of 0.3%. The drop was led by a 2.8% (-16.6% y/y) decline in agricultural prices. Nonagricultural export prices were unchanged and down 4.4% y/y.
The import and export price series can be found in Haver's USECON database. Detailed figures are available in the USINT database.
| Import/Export Prices (NSA, %) | September | August | July | Y/Y | 2008 | 2007 | 2006 |
|---|---|---|---|---|---|---|---|
| Import - All Commodities | 0.1 | 1.6 | -0.7 | -12.0 | 11.5 | 4.2 | 4.9 |
| Petroleum | -1.1 | 7.7 | -2.5 | -32.5 | 37.7 | 11.6 | 20.6 |
| Nonpetroleum | 0.4 | 0.3 | -0.2 | -5.4 | 5.3 | 2.7 | 1.7 |
| Export - All Commodities | -0.3 | 0.7 | -0.3 | -5.6 | 6.0 | 4.9 | 3.6 |
by Tom Moeller October, 14, 2009
Why hold inventories if they're loosing value and the demand outlook is uncertain? These two questions are behind the decumulation which continued through August. Business inventories fell another 1.5% which exceeded expectations for a 0.9% drop. The drop was pervasive amongst businesses and the 14.9% three-month rate of decline is a record.
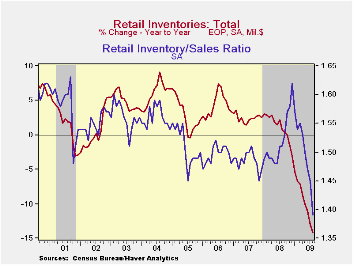
Retail inventories fell a hefty 2.3% during August. That was led by a 7.9% (-31.1% y/y) drop in auto inventories followed by a 0.3% (-6.4% y/y) shrinkage in nonauto inventories. Furniture inventories (-12.3% y/y) continued down as did clothing inventories (-8.7% y/y). General merchandise inventories posted an uptick but they still were off 4.1% y/y and building materials stores shed 0.6% of inventories (-9.0% y/y. Factory inventories fell 0.8% and at an accelerated 11.5% y/y. Wholesale inventories were off 1.3% and, excluding oil, wholesale inventories fell 1.5% (-15.0% y/y).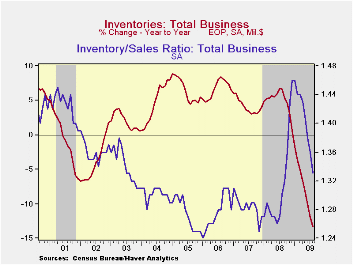
Businesses' success in slashing inventories has kept up with recent weakness in sales. As a result, the inventory-to-sales ratio for total business fell to its cycle low of 1.33 versus a high of 1.46 in January. The latest was the lowest since last September.
The business sales and inventory data are available in Haver's USECON database.
Disagreement About The Inflation Outlook from the Federal Reserve Bank of San Francisco is available here
| Business Inventories (%) | August | July | June | Y/Y | 2008 | 2007 | 2006 |
|---|---|---|---|---|---|---|---|
| Total | -1.5 | -1.1 | -1.4 | -13.3 | 0.6 | 4.0 | 6.4 |
| Retail | -2.3 | -1.0 | -1.2 | -14.1 | -3.1 | 2.5 | 3.3 |
| Retail excl. Auto | -0.3 | -0.5 | -0.5 | -6.4 | -1.8 | 2.7 | 4.7 |
| Wholesale | -1.3 | -1.6 | -2.1 | -14.7 | 3.1 | 6.2 | 8.2 |
| Manufacturing | -0.8 | -0.9 | -1.1 | -11.5 | 2.1 | 3.7 | 8.2 |

Tom Moeller
AuthorMore in Author Profile »Prior to joining Haver Analytics in 2000, Mr. Moeller worked as the Economist at Chancellor Capital Management from 1985 to 1999. There, he developed comprehensive economic forecasts and interpreted economic data for equity and fixed income portfolio managers. Also at Chancellor, Mr. Moeller worked as an equity analyst and was responsible for researching and rating companies in the economically sensitive automobile and housing industries for investment in Chancellor’s equity portfolio. Prior to joining Chancellor, Mr. Moeller was an Economist at Citibank from 1979 to 1984. He also analyzed pricing behavior in the metals industry for the Council on Wage and Price Stability in Washington, D.C. In 1999, Mr. Moeller received the award for most accurate forecast from the Forecasters' Club of New York. From 1990 to 1992 he was President of the New York Association for Business Economists. Mr. Moeller earned an M.B.A. in Finance from Fordham University, where he graduated in 1987. He holds a Bachelor of Arts in Economics from George Washington University.
More Economy in Brief


