 Global| Feb 07 2007
U.S. Productivity Stronger Than Expected in 4Q
by:Tom Moeller
|in:Economy in Brief
Summary
Nonfarm labor productivity grew 3.0% last quarter after a downwardly revised 0.1% downtick during 3Q06. The gain was well ahead of Consensus expectations and raised growth of 2.1% for the whole year about even with the 2.3% increase [...]
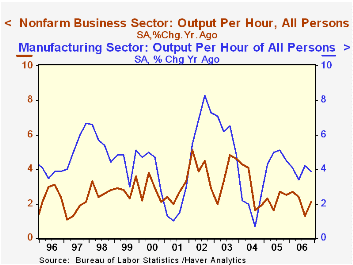
Nonfarm labor productivity grew 3.0% last quarter after a downwardly revised 0.1% downtick during 3Q06. The gain was well ahead of Consensus expectations and raised growth of 2.1% for the whole year about even with the 2.3% increase during 2005.
The implications of productivity growth were addressed directly in The Level and Distribution of Economic Well-Being, yesterday's speech by Fed Chairman Ben S. Bernanke and it can be found here.
Compensation per hour last quarter grew an accelerated 4.8% after an upwardly revised 3.1% gain during 3Q. Together, these growth rates pulled compensation growth for the year to 5.3% which was the strongest since a 7.2% increase during 2000.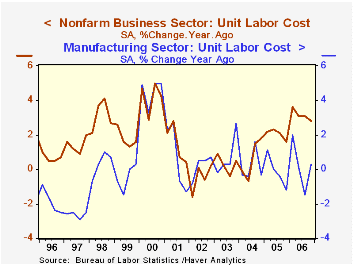
Unit labor cost growth moderated sharply to 1.7% from an upwardly revised 3.2% during 3Q as a result of the improvement in productivity. The full year gain in unit labor costs of 3.2% was the strongest since a 4.2% increase during 2000. During the last thirty years there has been an 85% correlation between labor cost growth the growth in the GDP chain price deflator, although that correlation has fallen sharply in recent years.
Factory sector productivity growth last quarter decelerated sharply to 2.2% from a little revised 6.3% jump during 3Q. The annual gain in factory sector productivity also fell to a still firm 3.9% from 4.7% in 2005. Factory sector compensation per hour jumped 7.3% after 3.3% growth during 3Q. The annual gain in compensation of 4.1% was down just a bit from 4.6% growth during 2005. Unit labor costs jumped 5.0% last quarter as a result of the surge in compensation. The surge nevertheless left the annual gain at a modest 0.2% after a 0.1% decline during 2005.
The Economic Outlook: Prospects for 2007 from Charles I Plosser, President, Federal Reserve Bank of Philadelphia is available here.
| Non-farm Business Sector (SAAR) | 4Q '06 | 3Q '06 | Y/Y | 2006 | 2005 | 2004 |
|---|---|---|---|---|---|---|
| Output per Hour | 3.0% | -0.1% | 2.1% | 2.1% | 2.3% | 3.0% |
| Compensation per Hour | 4.8% | 3.1% | 4.9% | 5.3% | 4.4% | 3.6% |
| Unit Labor Costs | 1.7% | 3.2% | 2.8% | 3.2% | 2.0% | 0.7% |
by Tom Moeller February 7, 2007
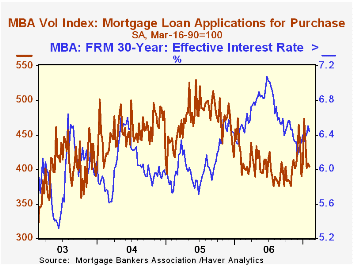
The total number of mortgage applications were about flat last week after a 3.2% jump at the end of January according to the Mortgage Bankers Association.
Purchase applications fell 0.8% marking the third decline in the last four weeks.
During the last ten years there has been a 58% correlation between the y/y change in purchase applications and the change in new plus existing single family home sales.
Applications to refinance were roughly unchanged after a sharp 4.9% gain during the prior week.
The effective interest rate on a conventional 30-year mortgage fell sharply to 6.44% and reversed most of the prior week's increase. Rates averaged 6.40% last month and 6.28% in December. The peak for 30 year financing was 7.08% late in June. Rates for 15-year financing also fell to 6.23%. Interest rates on 15 and 30 year mortgages are closely correlated (>90%) with the rate on 10 year Treasury securities.
During the last ten years there has been a (negative) 79% correlation between the level of applications for purchase and the effective interest rate on a 30-year mortgage.
The Mortgage Bankers Association surveys between 20 to 35 of the top lenders in the U.S. housing industry to derive its refinance, purchase and market indexes. The weekly survey covers roughly 50% of all U.S. residential mortgage applications processed each week by mortgage banks, commercial banks and thrifts. Visit the Mortgage Bankers Association site here.
Monetary Policy Inertia and Recent Fed Actions from the Federal Reserve Bank of San Francisco is available here.
| MBA Mortgage Applications (3/16/90=100) | 02/02/07 | 01/26/07 | Y/Y | 2006 | 2005 | 2004 |
|---|---|---|---|---|---|---|
| Total Market Index | 630.1 | 631.1 | 1.7% | 584.2 | 708.6 | 735.1 |
| Purchase | 404.7 | 408.0 | -4.8% | 406.9 | 470.9 | 454.5 |
| Refinancing | 1,943.4 | 1,940.2 | 11.0% | 1,634.0 | 2,092.3 | 2,366.8 |
by Carol Stone February 7, 2007
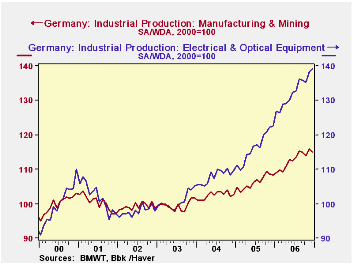
European industry is trying hard to grow and some sectors are more successful than others, according to data for December 2006 reported today by various statistical agencies. German production fell by 0.7% after a 1.8% surge in November. Its growth has moderated since August, but analysts were surprised by today's drop, having projected a gain for the month of about 0.5%. The VAT went up on January 1, so activity was expected to be strong through the end of 2006, but it appears to have tailed off earlier. Even so, industrial output for 2006 as a whole was up 6.1%, the strongest since the tech boom period in 2000.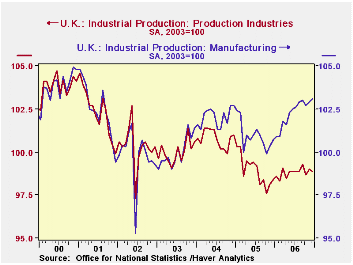
In the UK, basic manufacturing has done fairly well in 2006, with that sector's production index up 2.4% from a year ago (based on seasonally adjusted data) and the year total up 1.3% from 2005, more than reversing a decline in 2005. Machinery, especially electrical equipment, was the strongest segment. In Britain, mining is in a decline as oil production decreases. This is weighing significantly on total industrial production, which was up in December by only 0.5% from December 2005 and actually down modestly for the year as a whole compared with 2005. That year, it fell 1.8%.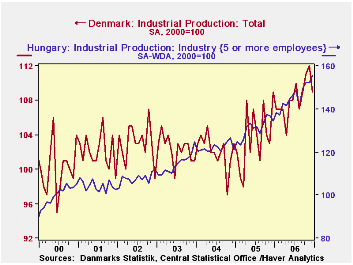
Denmark's industrial production fell back in December by 3 points (2.7%), but it enjoyed vigorous expansion through most of the rest of 2006. Wood products, clothing, oil refining and machinery all contributed sizable gains.
In Hungary, the number reported today is an advance estimate for a subset of the larger companies. Their production advanced 2.2% in December, bringing the gain to 11.2% for the year as a whole. Details for December will be reported on February 15. Through November, the breakdown looked similar to other neighboring nations, with strength greatest in machinery and equipment. In Hungary, rubber and plastics production has also been strong.
Sometimes, with all the publicity favoring manufacturing in Asia, one can get the impression that industry elsewhere is languishing. But as we see here, that is not so and especially for machinery, European companies are experiencing sizable growth.
| IP: Indexes, 2000=100 | Dec 2006 | Nov 2006 | Oct 2006 | Year Ago | 2006 | 2005 | 2004 |
|---|---|---|---|---|---|---|---|
| Germany: Total IP* | 115.2 | 116.0 | 113.8 | 108.6 | 112.9 | 106.4 | 102.6 |
| UK: Total IP** | 95.2 | 95.3 | 95.1 | 94.8 | 95.2 | 95.3 | 97.1 |
| Manufacturing** | 99.3 | 99.1 | 98.9 | 97.0 | 98.5 | 97.2 | 98.3 |
| Denmark: Total | 109 | 112 | 111 | 109 | 108 | 104 | 102 |
| Hungary: Total, 5 or more Employees | 155.6 | 152.2 | 152.3 | 134.4 | 145.8 | 131.1 | 122.1 |

Tom Moeller
AuthorMore in Author Profile »Prior to joining Haver Analytics in 2000, Mr. Moeller worked as the Economist at Chancellor Capital Management from 1985 to 1999. There, he developed comprehensive economic forecasts and interpreted economic data for equity and fixed income portfolio managers. Also at Chancellor, Mr. Moeller worked as an equity analyst and was responsible for researching and rating companies in the economically sensitive automobile and housing industries for investment in Chancellor’s equity portfolio. Prior to joining Chancellor, Mr. Moeller was an Economist at Citibank from 1979 to 1984. He also analyzed pricing behavior in the metals industry for the Council on Wage and Price Stability in Washington, D.C. In 1999, Mr. Moeller received the award for most accurate forecast from the Forecasters' Club of New York. From 1990 to 1992 he was President of the New York Association for Business Economists. Mr. Moeller earned an M.B.A. in Finance from Fordham University, where he graduated in 1987. He holds a Bachelor of Arts in Economics from George Washington University.


