 Global| Dec 05 2006
U.S. Productivity Little Revised, Compensation Lowered Sharply
by:Tom Moeller
|in:Economy in Brief
Summary
For 3Q '06, nonfarm labor productivity growth of 0.2% was little revised from the preliminary report. The figure fell short of Consensus expectations for a larger revision to 0.4% growth. The weak increase kept y/y growth in [...]
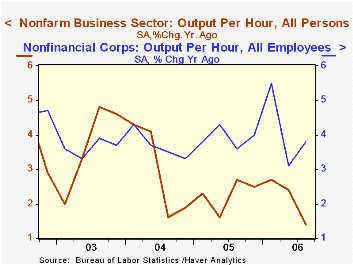
For 3Q '06, nonfarm labor productivity growth of 0.2% was little revised from the preliminary report. The figure fell short of Consensus expectations for a larger revision to 0.4% growth. The weak increase kept y/y growth in productivity at 1.4%, the weakest since 1997.
Compensation per hour, however, was revised sharply with the 3Q estimate taken down one percentage point to 2.6% growth. Combined with a huge downward revision to 2Q growth to -1.2% from +6.6% (not a typo) it lowered the y/y change to 4.3% which is on a par with the growth during the last several years.
The revisions to compensation lowered unit labor costs sharply as well to 2.3% growth last quarter. Growth during 2Q was lowered to -2.4% versus a previously estimated 5.4% gain. During the last thirty years there has been an 85% correlation between labor cost growth the growth in the GDP chain price deflator, although that correlation has fallen sharply in recent years.
Factory sector productivity growth last quarter was increased to 6.7% (4.5% y/y) from 5.9% but growth in factory sector compensation per hour was lowered just slightly to 2.4% (2.4% y/y) from 2.9%. The y/y gain in compensation is collapsed versus the previous estimate because of a sharp revision to 2Q growth to -5.8% (2.4% y/y) from +4.0% estimated last month. Unit labor costs as a result fell 4.1% during the third quarter (-2.0% y/y) after an 8.3% decline during the prior period.
Reported for the first time were 3Q estimates for the nonfinancial corporate sector. Productivity there rebounded 5.6% (3.8% y/y) after a 4.3% drop during 2Q that previously was reported as a 0.2% increase. Compensation grew 2.8% (4.3% y/y) after a 0.7% decline that was earlier estimated at +6.5%. As a result, unit labor costs fell 2.7% (+0.5% y/y) last quarter.
Unit profits for the nonfinancial corporate sector in this productivity report in fact grew 27.6% (19.0% y/y). These figures are in line with the sharp 8.2% (25.8% y/y) gain in nonfinancial corporate profits reported in last week's GDP report. Prices for the sector grew just 0.2% (1.8% y/y), the slowest quarterly increase in four years.
U.S. Economic Outlook is last Friday's speech by Chicago Fed president Michael H. Moskow and it can be found here.
| Non-farm Business Sector (SAAR) | 3Q '06 (Revised) | 3Q '06 | 2Q' 06 | Y/Y | 2005 | 2004 | 2003 |
|---|---|---|---|---|---|---|---|
| Output per Hour | 0.2% | 0.0% | 1.2% | 1.4% | 2.3% | 3.0% | 3.7% |
| Compensation per Hour | 2.6% | 3.7% | -1.2% | 4.3% | 4.4% | 3.6% | 4.0% |
| Unit Labor Costs | 2.3% | 3.8% | -2.4% | 2.9% | 2.0% | 0.7% | 0.3% |
by Tom Moeller December 5, 2006
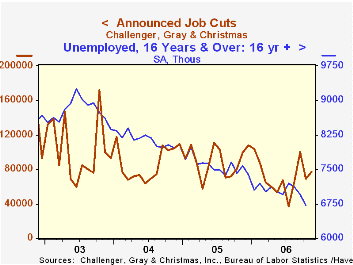
Announced job cuts reported by Challenger, Grey & Christmas for November rose 7,596 to 76,773. The three month moving average of layoff announcements continued its earlier uptrend with a rise to 82,088, its highest level since this past March.
During the last ten years there has been an 83% (inverse) correlation between the three month moving average level of announced job cuts and the three month change payroll employment.
Layoffs were higher m/m in the automotive (20.4% y/y), chemical (81.5% y/y), consumer goods (-3.1% y/y), industrial goods (133.3% y/y) and services (9.4% y/y) industries.
Job cut announcements differ from layoffs. Many are achieved through attrition, early retirement or just never occur.
Challenger also reported that announced hiring plans increased sharply m/m (-34.3% y/y).
| Challenger, Gray & Christmas | November | October | Y/Y | 2005 | 2004 | 2003 |
|---|---|---|---|---|---|---|
| Announced Job Cuts | 76,773 | 69,177 | -22.7% | 1,072,054 | 1,039,935 | 1,236,426 |
by Tom Moeller December 5, 2006
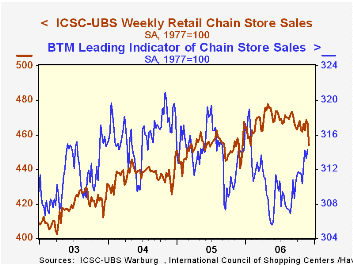
The ICSC-UBS retail chain-store sales index is constructed using the same-store sales (stores open for one year) reported by 78 stores of seven retailers: Dayton Hudson, Federated, Kmart, May, J.C. Penney, Sears and Wal-Mart.
Despite last week's sales drop, the leading indicator of chain store sales from ICSC-UBS recovered the prior period's 0.3% decline (-0.1% y/y) and was up roughly 3% from the early year low.
| ICSC-UBS (SA, 1977=100) | 12/02/06 | 11/25/06 | Y/Y | 2005 | 2004 | 2003 |
|---|---|---|---|---|---|---|
| Total Weekly Chain Store Sales | 454.4 | 466.5 | 3.1% | 3.6% | 4.7% | 2.9% |
by Tom Moeller December 5, 2006
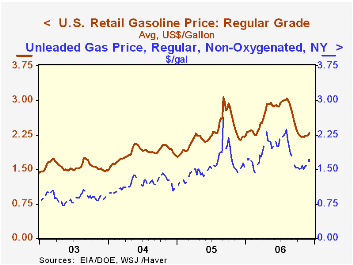
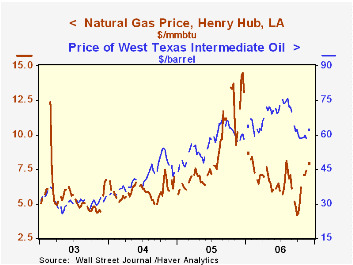 Seasonably cold temperatures also lifted natural gas prices to $7.91/mmbtu, the highest level since early August. The Natural Gas Distribution System can be found here.
The latest Short-Term Energy Outlook from the U.S. Energy Information Administration is available here.
| Weekly Energy Prices | 12/04/06 | 11/27/06 | Y/Y | 2005 | 2004 | 2003 |
|---|---|---|---|---|---|---|
| US Retail Gasoline Price, Regular | $2.30 | $2.25 | 7.0% | $2.27 | $1.85 | $1.56 |
by Tom Moeller December 5, 2006
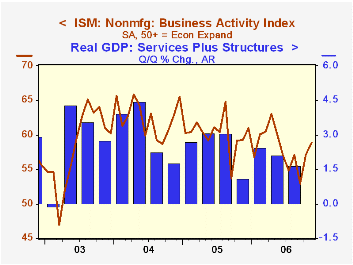
The non-manufacturing sector Business Activity Index rose unexpectedly to 58.9 from 57.1 in October. The figure from the Institute for Supply Management (ISM) exceeded Consensus expectations for a decline to 56.0. Thus far in 4Q the index has averaged 58.0 versus an average of 54.9 last quarter.
Since the series' inception in 1997 there has been a 50% correlation between the level of the Business Activity Index and the q/q change in real GDP for services plus construction.
The new orders sub-index improved to 57.1 from 56.5 in October and an average 55.0 during 3Q. The employment index also notched up to 51.6 from 51.0 in October but these figures were below the 3Q average of 53.2. Since the series' inception in 1997 there has been a 60% correlation between the level of the ISM non-manufacturing employment index and the m/m change in payroll employment in the service producing plus the construction industries.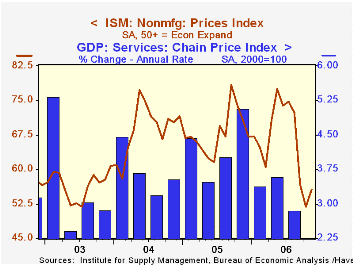
Pricing power improved modestly after sharp declines during four of the prior five months. At 55.6 the November figure remained well off the 3Q average of 68.0. Since inception eight years ago, there has been a 70% correlation between the price index and the y/y change in the GDP services chain price index.
ISM surveys more than 370 purchasing managers in more than 62 industries including construction, law firms, hospitals, government and retailers. The non-manufacturing survey dates back to July 1997.Business Activity Index for the non-manufacturing sector reflects a question separate from the subgroups mentioned above. In contrast, the NAPM manufacturing sector composite index is a weighted average five components.
| ISM Nonmanufacturing Survey | November | October | Nov. '05 | 2005 | 2004 | 2003 |
|---|---|---|---|---|---|---|
| Business Activity Index | 58.9 | 57.1 | 59.3 | 60.1 | 62.5 | 58.3 |
| Prices Index | 55.6 | 51.9 | 70.8 | 67.9 | 68.8 | 56.6 |

Tom Moeller
AuthorMore in Author Profile »Prior to joining Haver Analytics in 2000, Mr. Moeller worked as the Economist at Chancellor Capital Management from 1985 to 1999. There, he developed comprehensive economic forecasts and interpreted economic data for equity and fixed income portfolio managers. Also at Chancellor, Mr. Moeller worked as an equity analyst and was responsible for researching and rating companies in the economically sensitive automobile and housing industries for investment in Chancellor’s equity portfolio. Prior to joining Chancellor, Mr. Moeller was an Economist at Citibank from 1979 to 1984. He also analyzed pricing behavior in the metals industry for the Council on Wage and Price Stability in Washington, D.C. In 1999, Mr. Moeller received the award for most accurate forecast from the Forecasters' Club of New York. From 1990 to 1992 he was President of the New York Association for Business Economists. Mr. Moeller earned an M.B.A. in Finance from Fordham University, where he graduated in 1987. He holds a Bachelor of Arts in Economics from George Washington University.
More Economy in Brief


