 Global| Dec 13 2007
U.S. PPI Total Surged, Core Firm
by:Tom Moeller
|in:Economy in Brief
Summary
Finished producer prices surged 3.2% last month after little change during October. A 1.5% rise had been expected. Core finished goods producer prices rose a firm 0.4%, the strongest gain since this past February. Energy prices [...]
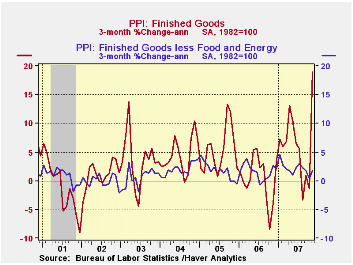
Finished producer prices surged 3.2% last month after little change during October. A 1.5% rise had been expected. Core finished goods producer prices rose a firm 0.4%, the strongest gain since this past February.
Energy prices increased 14.1% (25.7% y/y) led by a 34.8% (50.9% y/y) pop in the price of gasoline. Home heating oil prices also surged by 31.5% (36.0% y/y) but natural gas prices fell 5.2% (+1.0% y/y).
The firm gain in the core PPI almost wholly reflected a 0.6% rise in passenger car prices and a 2.3% surge in light truck prices.
Capital equipment prices rose 0.3% (1.3% y/y on the strength of light truck prices.
Food prices were unchanged (7.2% y/y) after 1.0%+ gains during the prior two months.
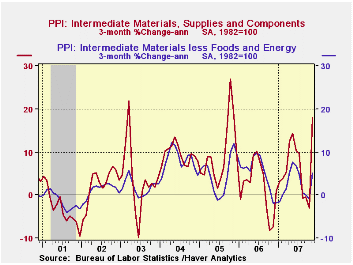
Intermediate goods prices surged 3.7% on the strength of higher energy prices and a 1.2% (16.3% y/y) surge in food prices. Excluding food & energy prices were also firm and rose 1.0% (3.3% y/y).
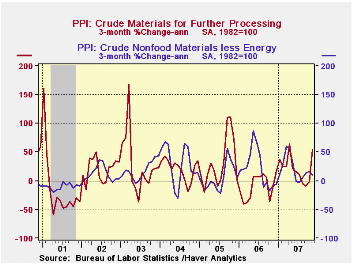
The crude materials PPI surged 8.7% led higher by a 17.0% (23.5% y/y) jump in energy prices. The core crude materials PPI fell 0.5%.
A Comparison of Measures of Core Inflation from the Federal Reserve Bank of New York can be found here.
| Producer Price Index | November | October | Y/Y | 2006 | 2005 | 2004 |
|---|---|---|---|---|---|---|
| Finished Goods | 3.2% | 0.1% | 7.7% | 2.9% | 4.9% | 3.6% |
| Core | 0.4% | 0.0% | 1.9% | 1.4% | 2.4% | 1.5% |
| Intermediate Goods | 3.7% | 0.1% | 8.6% | 6.4% | 8.0% | 6.6% |
| Core | 1.0% | 0.1% | 3.3% | 6.0% | 5.5% | 5.7% |
| Crude Goods | 8.7% | 2.4% | 22.2% | 1.4% | 14.6% | 17.5% |
| Core | -0.5% | 1.4% | 18.9% | 20.9% | 4.9% | 26.5% |
by Tom Moeller December 13, 2007
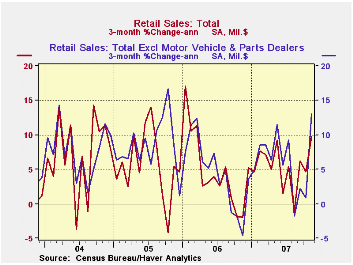
November U.S. retail sales doubled expectations for a 0.6% increase and rose 1.2%. That followed an unrevised 0.2% gain during October. The gains occurred despite the recent sharp drop in consumer sentiment.
Excluding autos sales also beat expectations for a 0.7% gain and rose 1.8% after a 0.4% increase during the prior month.
The strength was not all attributable to higher gasoline prices. Less gasoline, nonauto sales rose 1.1% following the meager 0.1% October uptick
Sales of discretionary items were notably
firm last month. Apparel store sales surged 2.6%
(6.6% y/y) but the prior month was revised down to a 0.5% decline. Furniture,
home furnishings & appliance stores sales also
surged 1.7% after the 0.3% rise during October. Prior months' slight
declines were revised positive. Sales of electronics &
appliances jumped 2.5% (5.0% y/y). Sales at general
merchandise stores increased 0.9% (5.0% y/y) after a little
revised 0.1% October uptick.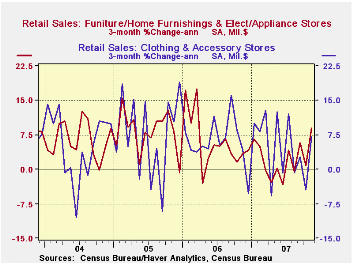
Even sales of building materials were strong during November and posted a 1.2% (0.8% y/y) increase, though the prior month was revised down to a 0.8% decline.
Sales of nonstore retailers (internet & catalogue) ballooned 1.9% (10.7% y/y) and the prior month's decline was revised to a 0.4% increase.
Motor vehicle & parts purchases fell 1.0% (+1.9% y/y). The decline was somewhat at odds with the 0.9% m/m rise in unit sales of light vehicles during November.
Gasoline service station sales jumped 6.8%, lifted by the 9.9% m/m rise in gasoline prices. The 3.1% rise during October was very much upwardly revised. So far this month gas prices are down 1.6% from the November average of $3.08 per gallon.
Corporate Access to External Financing from the Federal Reserve Bank of San Francisco can be found here.
| November | October | Y/Y | 2006 | 2005 | 2004 | |
|---|---|---|---|---|---|---|
| Retail Sales & Food Services | 1.2% | 0.2% | 6.3% | 6.2% | 6.6% | 6.1% |
| Excluding Autos | 1.8% | 0.4% | 7.4% | 7.3% | 7.6% | 7.1% |
| Less Gasoline | 1.1% | 0.1% | 5.3% | 7.2% | 6.6% | 6.1% |
by Tom Moeller December 13, 2007
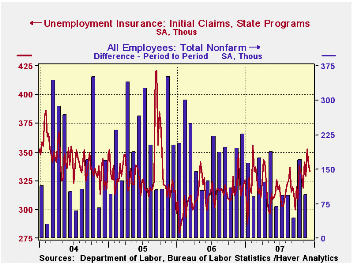
Last week, initial claims for jobless insurance fell a modest 7,000 to 333,000 but the prior week's level was revised up slightly.
The four week moving average of initial claims, a measure which smoothes out most of the series' w/w volatility, dipped to 338,750 (4.0% y/y), near the highest level since 2005.
A claims level below 400,000 typically has been associated with growth in nonfarm payrolls. During the last six years there has been a (negative) 78% correlation between the level of initial claims and the m/m change in nonfarm payroll employment.
Continuing claims for unemployment insurance rose 38,000 after an unrevised 59,000 decline during the prior week.
The continuing claims numbers lag the initial claims figures by one week.
The insured rate of unemployment held at 2.0% for the third consecutive week.
Fixing the New Keynesian Phillips Curve also from the Federal Reserve Bank of San Francisco is available here.
| Unemployment Insurance (000s) | 12/08/07 | 12/01/07 | Y/Y | 2006 | 2005 | 2004 |
|---|---|---|---|---|---|---|
| Initial Claims | 333 | 340 | 6.7% | 313 | 331 | 343 |
| Continuing Claims | -- | 2,639 | 7.0% | 2,459 | 2,662 | 2,924 |
by Robert Brusca December 13, 2007
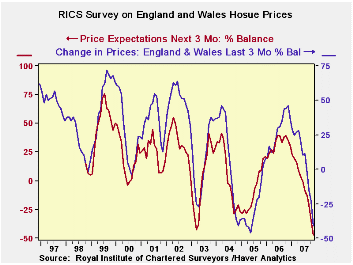
The RICs survey presents as its metric a net balance reading
as surveys respond by saying house prices are higher or lower. Both
series show a larger progressive trend lower that is represented by
sequentially lower peaks in the various cycles and, for the most part,
sequentially lower troughs as well. Beyond this longer term trend
decline in this metric is the sharp plunge in both prices over the past
three months and expected prices in the next three months. The price
expectations series gives off useful signals at the peaks since it
peaks at a lower level than the past three month series but it is
usually too pessimistic at the troughs. The look-ahead series is
looking for even deeper declines in the next three months than in the
last three months at this time. Look for the actual data to turn more
positive ahead of the expectations series. But, for the moment, both
show bleak readings and both are on their respective lowest readings
since 1999.
| RICS: House prices and expectations for prices and sales | |||||||
|---|---|---|---|---|---|---|---|
| Nov-07 | Oct-07 | Sep-07 | 3-Mo Avg | 6-Mo Avg | 12-Mo Avg | Range Percentile |
|
| Prices | -41 | -23 | -15 | -26 | -10 | 9 | 0.0% |
| Price Expectations | -47 | -35 | -21 | -34 | -21 | -2 | 0.0% |
| Sales expectations | -8 | -6 | -9 | -8 | -5 | 6 | 2.2% |
| New Sales | -36 | -33 | -28 | -32 | -24 | -11 | 0.0% |
| Range percentile takes range back to 1999 | |||||||

Tom Moeller
AuthorMore in Author Profile »Prior to joining Haver Analytics in 2000, Mr. Moeller worked as the Economist at Chancellor Capital Management from 1985 to 1999. There, he developed comprehensive economic forecasts and interpreted economic data for equity and fixed income portfolio managers. Also at Chancellor, Mr. Moeller worked as an equity analyst and was responsible for researching and rating companies in the economically sensitive automobile and housing industries for investment in Chancellor’s equity portfolio. Prior to joining Chancellor, Mr. Moeller was an Economist at Citibank from 1979 to 1984. He also analyzed pricing behavior in the metals industry for the Council on Wage and Price Stability in Washington, D.C. In 1999, Mr. Moeller received the award for most accurate forecast from the Forecasters' Club of New York. From 1990 to 1992 he was President of the New York Association for Business Economists. Mr. Moeller earned an M.B.A. in Finance from Fordham University, where he graduated in 1987. He holds a Bachelor of Arts in Economics from George Washington University.
More Economy in Brief


