 Global| Nov 14 2007
U.S. PPI Total & Core Weak
by:Tom Moeller
|in:Economy in Brief
Summary
Finished producer prices ticked up just 0.1% during October following the firm 1.1% rise during September. The gain was the smallest since June and was slightly less than Consensus expectations for a 0.3% rise. Nevertheless, it lifted [...]
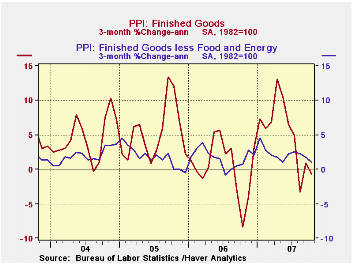
Finished producer prices ticked up just 0.1% during October following the firm 1.1% rise during September. The gain was the smallest since June and was slightly less than Consensus expectations for a 0.3% rise. Nevertheless, it lifted the y/y increase to 6.0% its strongest in two years.
Core finished goods producer prices were
unchanged last month. It was the first month without an increase in
prices since a slight decline this past March and it was less than the
expected 0.2% increase. Again, it left the y/y gain at 2.5% which was
its strongest in two years. The recent momentum in core producer prices
did, however, fall to its lowest of 1.0% since May.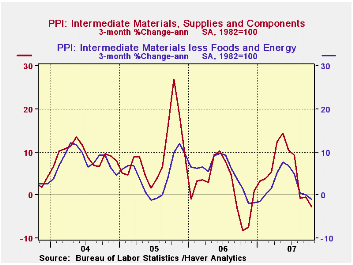
Energy prices fell 0.8% (16.1% y/y) as prices for gasoline fell 0.8% (+32.4% y/y) after the 4.7% September jump. Natural gas prices also fell 0.5% (+7.7% y/y) but home heating oil prices increased 3.2% (16.2% y/y.
Food prices were again strong and rose 0.8% (7.1% y/y) on the heels of a 1.5% jump during September. Vegetable prices soared 29.1% (27.0% y/y) but beef prices fell 2.1% (+1.5% y/y).
Household appliance prices were firm and rose 0.4% (1.2% y/y) after two months of 0.2% decline while passenger car prices jumped 5.7% (0.4% y/y).
Capital equipment prices jumped 1.0% (2.0% y/y) reflecting
strength in most categories. 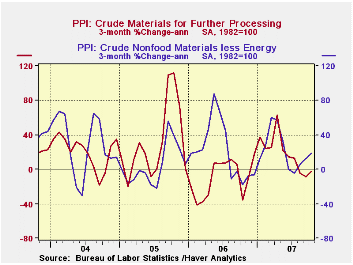
Intermediate goods prices ticked up 0.1% and the index
excluding food & energy prices again rose a small 0.1%. Prices
for steel mill products fell 1.8%, the fourth month of sharp decline.
The crude materials PPI rose 2.4% led higher by a 3.7% (4.1% y/y) gain in crude petroleum and a 9.7% (37.6% y/y) rise in natural gas prices. The core crude materials PPI also was strong and rose 1.4%. Iron & steel scrap prices again rose 1.4% (29.8% y/y).
Today's speech by Federal Reserve Chairman Ben S. Bernanke on Federal Reserve Communications can be found here.
| Producer Price Index | October | September | Y/Y | 2006 | 2005 | 2004 |
|---|---|---|---|---|---|---|
| Finished Goods | 0.1% | 1.1% | 6.0% | 2.9% | 4.9% | 3.6% |
| Core | 0.0% | 0.1% | 2.5% | 1.4% | 2.4% | 1.5% |
| Intermediate Goods | 0.1% | 0.4% | 5.4% | 6.4% | 8.0% | 6.6% |
| Core | 0.1% | 0.1% | 1.9% | 6.0% | 5.5% | 5.7% |
| Crude Goods | 2.4% | 0.1% | 25.6% | 1.4% | 14.6% | 17.5% |
| Core | 1.4% | 1.6% | 18.8% | 20.9% | 4.9% | 26.5% |
by Tom Moeller November 14 2007
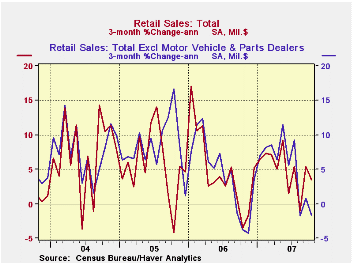
U.S. retail sales last month rose 0.2% after the 0.7% September increase which revised up slightly. The gain matched expectations and the prior month's 0.7% was revised up slightly.
Excluding autos, sales rose 0.2% and the prior month's gain of 0.4% was revised down slightly to 0.3%. A 0.3% October increase had been expected.
Nonauto retail sales less gasoline ticked up just
0.1% (3.9% y/y) after an unrevised 0.2% rise in September. The 0.1%
decline during August was revised down to a 0.5% drop.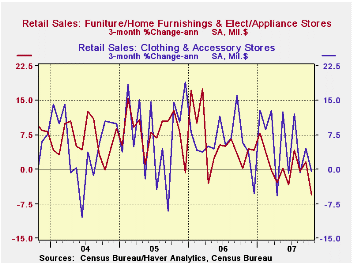
Sales of discretionary items were generally weak last month. Furniture, home furnishings & appliance stores sales fell 0.4% (0.8% y/y) and the prior month's gain was revised down to a 0.8% decline. Sales have declined in four of the last five months. Sales at general merchandise stores fell 0.1% (+3.6 y/y). Apparel store sales rose 0.1% (4.4% y/y) but the prior month's decline was revised up to a 0.1% increase.
Building material sales rose a firm 0.6% (1.3% y/y) though the prior month's gain of 0.8% was revised down to a 0.4% decline.
Sales of nonstore retailers (internet & catalogue) fell 1.0% (5.9% y/y) after a little revised 0.9% September increase.
Motor vehicle & parts purchases rose 0.2% (5.0% y/y) but unit sales of light vehicles fell 1.1% m/m in October.
Gasoline service station sales rose 0.8% after the 1.8% September gain. Higher gas prices should lift this month's increase.
The recent Treasury Dept. study of Income Mobility is available here.
| October | September | Y/Y | 2006 | 2005 | 2004 | |
|---|---|---|---|---|---|---|
| Retail Sales & Food Services | 0.2% | 0.7% | 5.2% | 6.2% | 6.6% | 6.1% |
| Excluding Autos | 0.2% | 0.3% | 5.2% | 7.3% | 7.6% | 7.1% |
by Tom Moeller November 14, 2007
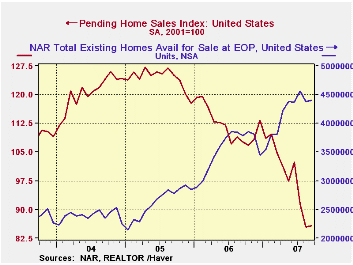
The National Association of Realtors reported that for September, level of pending home sales held steady at the August level. That level was, however, still down 20.4% from one year earlier and 24.4% year to date.
The latest monthly figure is about one third below the peak average level during 2005. The data date back only to 2001.
These figures are analogous to the new home sales data from
the Commerce Dept. in that they measure home sales when the sales
contract is signed, not at the time the sale is closed.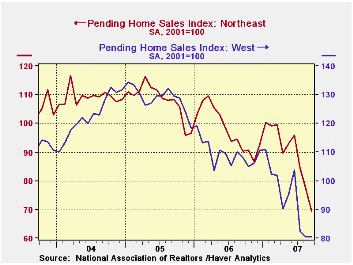
In further confirmation of the slow rate of home sales, the Realtors indicated in an earlier report that the number of homes on the market and available for sale rose September to a level 16.3% above the year earlier level.
In the Western part of the nation, sales were about unchanged m/m but remained down 25.6% from one year earlier.
In the Northeast, pending home sales are down 23.1% y/y. In the Midwest sales are down 14.4% and in the South sales are down 19.7%.
The pending home sales data are available in Haver's PREALTOR database and the number of homes on the market are in the REALTOR database.
| Pending Home Sales (2001=100) | September | August | Y/Y | 2006 | 2005 | 2004 |
|---|---|---|---|---|---|---|
| Total | 85.7 | 85.5 | -20.4% | 112.1 | 124.2 | 120.5 |
by Robert Brusca November 14 2007
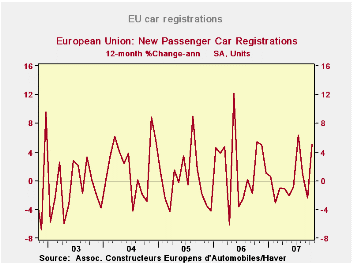
European car registrations jumped by 11.6% Y/Y following a
drop of 8.2% in September. Despite gains in two of the past three
months, sales are still lower year to date in 2007, by 0.4% compared to
sales last year. Germany lags the most as its year-to-date (YTD) sales
are lower by 7.7% through October. Spain is also lagging but with sales
off by 1.6% YTD. Italy is up strongly, by 6.9%, on a year-to-date
basis- surprising for a country where growth has been so weak. The UK
and France have stronger year-to-date numbers of 1.4% and 0.9%
respectively. Auto sales are mostly weak on the back of the German VAT
tax hike that shoved sales into late 2006 to avoid the tax. Apart from
that, European sales are doing ok. Excluding Germany European auto
sales are up by 2.6% over last year on a YTD basis.
| Ezone Car Registrations | |||||||||
|---|---|---|---|---|---|---|---|---|---|
| Mo/Mo % | 3-Mo Trend From |
6-Mo Trend From |
12-Mo Trend From |
||||||
| All Seas Adj | Oct 07 |
Sep 07 |
Aug 07 |
Oct 07 |
Sep 07 |
Oct 07 |
Sep 07 |
Oct 07 |
Sep 07 |
| Ezone Registrations | 11.6% | -8.2% | 3.8% | 28.0% | -17.5% | 32.2% | -10.9% | 4.2% | -4.1% |
| Germany: | 6.2% | -7.4% | 6.3% | 19.5% | 5.4% | 31.6% | -5.5% | -4.1% | -11.1% |
| France (WDA) | -0.2% | 3.7% | -4.1% | -2.9% | 12.0% | 11.7% | 7.5% | 4.6% | 7.7% |
| Italy | 11.5% | -10.6% | 10.5% | 47.2% | -39.0% | 10.8% | -12.4% | 8.5% | -0.3% |
| Spain | 11.4% | -9.5% | 5.3% | 27.3% | -25.0% | 28.1% | -25.8% | 3.8% | -7.9% |
| UK | 7.1% | 22.0% | -20.0% | 19.6% | -0.3% | 11.6% | -8.2% | 7.2% | -0.6% |
| Base Month of Calc | Sep-07 | Aug-07 | Jul-07 | Jul-07 | Jun-07 | Apr-07 | Mar-07 | Oct-06 | Sep-06 |
by Carol Stone November 14, 2007
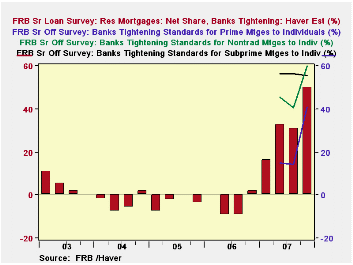
This past spring, as disruptions in the residential mortgage market became more severe, the Federal Reserve's Division of Monetary Affairs revised some of the relevant questions on its quarterly Senior Loan Officer Opinion Survey. Rather than inquiring about mortgage demand and lending policies in general, they broke the category down into three, "prime", "subprime" and "nontraditional". While this modification is more descriptive of banks' current situations, it gave no basis for comparison of current practice with previous periods.
So last week, following the release of the Q4 survey data, a number of Haver clients called the Client Hotline, asking if there wasn't something we could do with the information. Carol Stone here at Haver devised a method for re-combining the three new questions into an overall mortgage item.
On the lending policy aspect, banks report whether they have
"tightened" lending standards "considerably" or "somewhat" or "eased
considerably" or "somewhat" or left their lending policy "basically
unchanged". We simply added the responses together for each loan type
and took that total as a percentage of the total responses. This
ignores the response "do not offer" for each one, so the answers we've
used cover only banks that are active lenders in each category.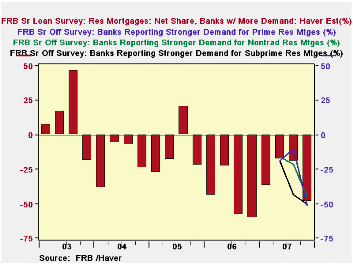
The results show a dramatic policy shift. Through nearly all of 2006, banks were easing their lending approval criteria, at least in a modest way. They switched toward tightening in Q4 and then moved much more aggressively in the new year. The old "total" mortgage series shows a net tightening of 16.4% in the January survey; the Haver calculations show that doubling by April to 32.7% and reaching 50% in the latest poll. The actual measure here is a "net", that is, those tightening less those easing, but in the last three quarters, no one has eased lending standards. So the latest responses show 50% tightening and 50% "basically unchanged". In the table below, we show the original Federal Reserve series in regular typeface, and the Haver figures in italics.
Demand for home mortgages -- at least as reported by the responding banks -- is weakening, although the recent performance here is no worse than last year. In fact, Q3 and Q4 of 2006 show the biggest negatives, -58.5% and -60.4%, respectively. During 2007, the weighted total of the new series moderated during the spring and early summer, but the latest survey shows renewed erosion to -48.5%. These demand figures reflect not only overall consumer demand for home purchase and/or other mortgage credit, but also the competitive mix of lending institutions. The moderation of banks' demand experience during part of this year could indicate a relative turn toward banks as mortgage companies and others pulled back more severely from the market.
We were cautioned by Federal Reserve analysts about making
these combination series, and we, in turn, need to pass that caution to
you as you use them. These are rough guides to the direction and degree
of changes in bank mortgage lending standards and loan demand. But they
cannot be numerically precise. The reason is that the three types of
loans, prime, subprime and nontraditional, are not completely separate
from each other. Prime loans include some nontraditional loans, as do
subprime loans. Other nontraditional loans are classified by the
lenders as a distinct category, neither prime nor subprime. So there is
an indeterminate amount of double-counting in our simple summation of
the total survey responses. Nonetheless, the resulting series look like
what we'd expect: greatly tightening lending policies and weakening
loan demand.
| Senior Loan Officers Survey | Oct 2007 | July 2007 | Apr 2007 | Jan 2007 | 2006 | 2005 | 2004 |
|---|---|---|---|---|---|---|---|
| Total Mortgages: Haver Series: Net Tightening | 50.0 | 30.8 | 32.7 | 16.4 | -4.2 | -3.4 | -3.4 |
| Prime | 40.8 | 14.3 | 15.1 | -- | -- | -- | -- |
| Nontraditional | 60.0 | 40.5 | 45.5 | -- | -- | -- | -- |
| Subprime | 55.5 | 56.3 | 56.3 | -- | -- | -- | -- |
| Haver
Mortgage Series: Net Demand |
-48.5 | -19.4 | -17.7 | -37.0 | -46.5 | -11.9 | -19.1 |
| Prime | -51.0 | -10.0 | -18.9 | -- | -- | -- | -- |
| Nontraditional | -45.0 | -21.3 | -15.9 | -- | -- | -- | -- |
| Subprime | -50.0 | -43.8 | -18.8 | -- | -- | -- | -- |

Tom Moeller
AuthorMore in Author Profile »Prior to joining Haver Analytics in 2000, Mr. Moeller worked as the Economist at Chancellor Capital Management from 1985 to 1999. There, he developed comprehensive economic forecasts and interpreted economic data for equity and fixed income portfolio managers. Also at Chancellor, Mr. Moeller worked as an equity analyst and was responsible for researching and rating companies in the economically sensitive automobile and housing industries for investment in Chancellor’s equity portfolio. Prior to joining Chancellor, Mr. Moeller was an Economist at Citibank from 1979 to 1984. He also analyzed pricing behavior in the metals industry for the Council on Wage and Price Stability in Washington, D.C. In 1999, Mr. Moeller received the award for most accurate forecast from the Forecasters' Club of New York. From 1990 to 1992 he was President of the New York Association for Business Economists. Mr. Moeller earned an M.B.A. in Finance from Fordham University, where he graduated in 1987. He holds a Bachelor of Arts in Economics from George Washington University.
More Economy in Brief


