 Global| Oct 12 2007
U.S. PPI Strong, Core Weak
by:Tom Moeller
|in:Economy in Brief
Summary
Finished producer prices rose 1.1% last month and recouped virtually all of the 1.4% decline during August. The increase, led by higher food & energy prices, topped consensus expectations for a 0.4% rise. Energy prices were strongest [...]
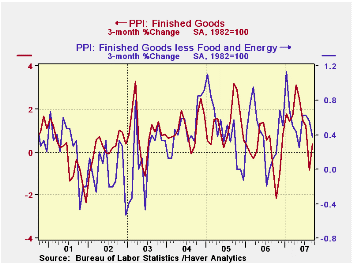
Finished producer prices rose 1.1% last month and recouped virtually all of the 1.4% decline during August. The increase, led by higher food & energy prices, topped consensus expectations for a 0.4% rise.
Energy prices were strongest and surged 4.1% after the prior month's 6.6% drop. Gasoline prices jumped 8.4% (21.6% y/y) after a 13.8% August drop and natural gas prices rose 3.2% (1.5% y/y).Home heating oil prices increased 2.0% (8.9% y/y.
Food prices jumped 1.5% (5.8% y/y) after four consecutive months of decline. Much higher prices for beef, eggs and fresh fruit led the advance last month.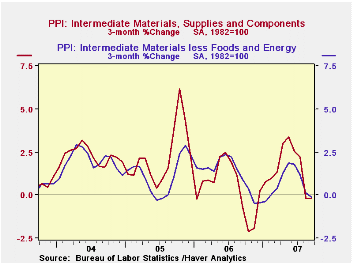
The core finished goods PPI increased a modest 0.1% which was half the expected 0.2% rise. The three month change of 0.4% was its lowest since May.
A 0.5% increase in household furniture prices was offset by a 1.8% decline in passenger cars.
Capital equipment prices also fell 0.1% after two months of 0.1% increases. Prices for light motor trucks fell 0.5% and civilian aircraft prices rose just 0.3%.
Intermediate goods prices made up a piece of the prior month's 1.2% decline with a 0.4% increase. The index excluding food & energy prices rose a small 0.1% as prices for steel mill products fell another 1.2%.
John Taylor's Contributions to Monetary Theory and Policy are today's remarks by Fed Chairman Ben S. Bernanke and they are available here.
| Producer Price Index | September | August | Y/Y | 2006 | 2005 | 2004 |
|---|---|---|---|---|---|---|
| Finished Goods | 1.1% | -1.4% | 4.4% | 2.9% | 4.9% | 3.6% |
| Core | 0.1% | 0.2% | 2.0% | 1.4% | 2.4% | 1.5% |
| Intermediate Goods | 0.4% | -1.2% | 4.0% | 6.4% | 8.0% | 6.6% |
| Core | 0.1% | -0.5% | 1.7% | 6.0% | 5.5% | 5.7% |
| Crude Goods | 0.1% | -3.0% | 11.4% | 1.4% | 14.6% | 17.5% |
| Core | 1.6% | 1.3% | 14.0% | 20.9% | 4.9% | 26.5% |

Tom Moeller
AuthorMore in Author Profile »Prior to joining Haver Analytics in 2000, Mr. Moeller worked as the Economist at Chancellor Capital Management from 1985 to 1999. There, he developed comprehensive economic forecasts and interpreted economic data for equity and fixed income portfolio managers. Also at Chancellor, Mr. Moeller worked as an equity analyst and was responsible for researching and rating companies in the economically sensitive automobile and housing industries for investment in Chancellor’s equity portfolio. Prior to joining Chancellor, Mr. Moeller was an Economist at Citibank from 1979 to 1984. He also analyzed pricing behavior in the metals industry for the Council on Wage and Price Stability in Washington, D.C. In 1999, Mr. Moeller received the award for most accurate forecast from the Forecasters' Club of New York. From 1990 to 1992 he was President of the New York Association for Business Economists. Mr. Moeller earned an M.B.A. in Finance from Fordham University, where he graduated in 1987. He holds a Bachelor of Arts in Economics from George Washington University.
More Economy in Brief


