 Global| Oct 12 2007
U.S. PPI Strong, Core Weak
by:Tom Moeller
|in:Economy in Brief
Summary
Finished producer prices rose 1.1% last month and recouped virtually all of the 1.4% decline during August. The increase, led by higher food & energy prices, topped consensus expectations for a 0.4% rise. Energy prices were strongest [...]
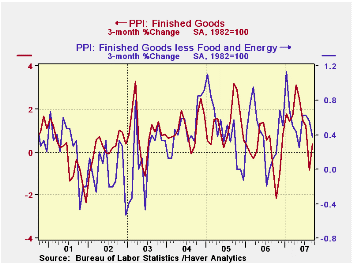
Finished producer prices rose 1.1% last month and recouped virtually all of the 1.4% decline during August. The increase, led by higher food & energy prices, topped consensus expectations for a 0.4% rise.
Energy prices were strongest and surged 4.1% after the prior month's 6.6% drop. Gasoline prices jumped 8.4% (21.6% y/y) after a 13.8% August drop and natural gas prices rose 3.2% (1.5% y/y).Home heating oil prices increased 2.0% (8.9% y/y.
Food prices jumped 1.5% (5.8% y/y) after four consecutive months of decline. Much higher prices for beef, eggs and fresh fruit led the advance last month.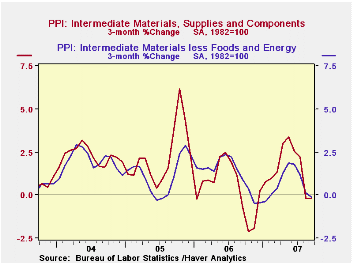
The core finished goods PPI increased a modest 0.1% which was half the expected 0.2% rise. The three month change of 0.4% was its lowest since May.
A 0.5% increase in household furniture prices was offset by a 1.8% decline in passenger cars.
Capital equipment prices also fell 0.1% after two months of 0.1% increases. Prices for light motor trucks fell 0.5% and civilian aircraft prices rose just 0.3%.
Intermediate goods prices made up a piece of the prior month's 1.2% decline with a 0.4% increase. The index excluding food & energy prices rose a small 0.1% as prices for steel mill products fell another 1.2%.
John Taylor's Contributions to Monetary Theory and Policy are today's remarks by Fed Chairman Ben S. Bernanke and they are available here.
| Producer Price Index | September | August | Y/Y | 2006 | 2005 | 2004 |
|---|---|---|---|---|---|---|
| Finished Goods | 1.1% | -1.4% | 4.4% | 2.9% | 4.9% | 3.6% |
| Core | 0.1% | 0.2% | 2.0% | 1.4% | 2.4% | 1.5% |
| Intermediate Goods | 0.4% | -1.2% | 4.0% | 6.4% | 8.0% | 6.6% |
| Core | 0.1% | -0.5% | 1.7% | 6.0% | 5.5% | 5.7% |
| Crude Goods | 0.1% | -3.0% | 11.4% | 1.4% | 14.6% | 17.5% |
| Core | 1.6% | 1.3% | 14.0% | 20.9% | 4.9% | 26.5% |
by Tom Moeller October 12, 2007
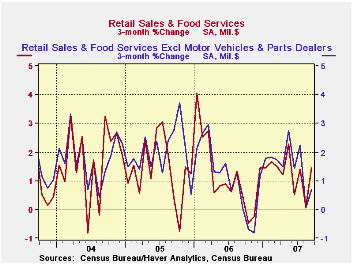
U.S. September retail sales rise of 0.6% beat forecasts for a 0.2% uptick. The prior month's 0.3% gain was unrevised.
A 1.2% advance in motor vehicle purchases added to a 3.3% August rise.
Excluding autos, sales rose 0.4% and offset a 0.4% decline in August. A 0.3% gain had been expected.Nonauto retail sales less gasoline rose just 0.2% (4.5% y/y) after an unrevised 0.1% decline during August. The movement followed a 0.8% July rise but no change in June.
Gasoline service station sales surged 2.0% but gas prices at the pump rose just 0.6% to an average $2.80 per gallon (9.7% y/y).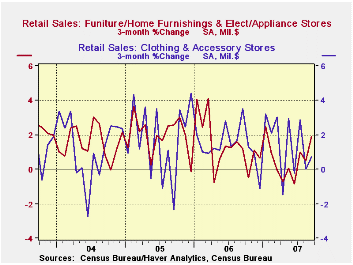
Sales of discretionary items were generally weak last month. Furniture, home furnishings & appliance stores rose just 0.1% (1.7% y/y) after a 0.4% August rise. Sales at general merchandise stores fell 0.1% (+3.7 y/y) and that gain is down from 5%+ increases this Summer. Apparel store sales fell 0.4% (+2.4% y/y), the third monthly decline in the last four
Building material sales recovered 0.8% (-0.6% y/y), perhaps reflecting the warm September weather.
Sales of nonstore retailers (internet & catalogue) surged 1.1%% (8.7% y/y) and recovered from a 0.9% drop the prior month.
A Taylor Rule and the Greenspan Era from the Federal Reserve Bank of Richmond can be found here.
| September | August | Y/Y | 2006 | 2005 | 2004 | |
|---|---|---|---|---|---|---|
| Retail Sales & Food Services | 0.6% | 0.3% | 5.0% | 6.2% | 6.6% | 6.1% |
| Excluding Autos | 0.4% | -0.4% | 3.9% | 7.3% | 7.6% | 7.1% |
by Tom Moeller October 12, 2007
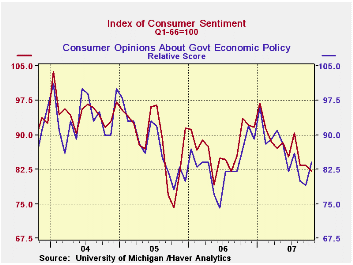
The University of Michigan's preliminary reading of consumer sentiment in early October fell 1.7% to 82.0 after no change in September and a huge 7.7% drop in August. The decline exceeded Consensus expectations for a reading of 84.0.
Lower consumer expectations accounted for all of the fall. The decline offset a slight improvement in September.
Long term, expectations about personal finances and business conditions during the next year fell for the sixth month this year out of ten. Expectations about business conditions rose slightly but hardly offset huge declines in the prior two months.
The view of the current economic conditions improved due to a slight increase in the view of current personal finances. The perspective of current buying conditions also improved slightly.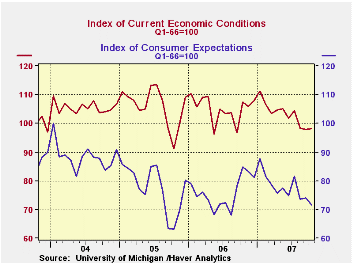
The assessment of government policy in October recovered the declines during the prior two months.
The University of Michigan survey is not seasonally adjusted.The reading is based on telephone interviews with about 500 households at month-end.
| University of Michigan | October (Prelim.) | September | October y/y | 2006 | 2005 | 2004 |
|---|---|---|---|---|---|---|
| Consumer Sentiment | 82.0 | 83.4 | -12.4% | 87.3 | 88.5 | 95.2 |
| Current Conditions | 98.2 | 97.9 | -8.5% | 105.1 | 105.9 | 105.6 |
| Expectations | 71.6 | 74.1 | -15.6% | 75.9 | 77.4 | 88.5 |
by Robert Brusca October 12, 2007
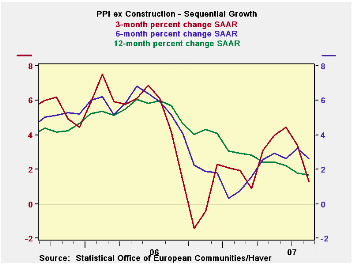
The year/year ex-construction PPI continues to head lower, while the six-month measure has seen some steady pressure and recent quasi-plateauing. But the three- month PPI is heading strongly lower. On balance, the Euro Area PPI seems to be well-behaved.
The trends are well-behaved across components as well. Only consumer goods prices at the producer level are showing any acceleration in the recent three months among major categories. Capital good prices are decelerating as are intermediate and energy goods. Manufacturing as a whole shows prices decelerating and the PPI ex-energy is also decelerating. The EMU PPI is well contained.
At the country level, Germany and Italy show the same sort of compliant patterns in their respective PPIs. The EU’s UK demonstrates some flare up in the overall PPI but still shows a PPI ex energy with decelerating trends. These are encouraging trends but this is not the ECB’s prime inflation measure. That one, the HICP, has been showing some pressure lately. But the lack of pressure at the PPI level is still good news – at least through August.
| Euro Area and UK PPI Trends | ||||||
|---|---|---|---|---|---|---|
| M/M | Saar | |||||
| Euro Area13 | Aug-07 | Jul-07 | 3-Mo | 6-MO | Yr/Yr | Y/Y Yr Ago |
| Total ex Construction | 0.1% | 0.3% | 1.7% | 3.2% | 1.7% | 5.7% |
| Excl Energy | 0.2% | 0.2% | 2.5% | 3.2% | 2.9% | 3.6% |
| Capital Goods | 0.0% | 0.1% | 0.6% | 0.9% | 1.6% | 1.6% |
| Consumer Goods | 0.5% | 0.4% | 4.4% | 3.3% | 2.3% | 1.9% |
| Intermediate & Capital Goods | 0.1% | 0.1% | 1.3% | 3.0% | 3.3% | 4.6% |
| Energy | -0.7% | 0.4% | -1.2% | 3.3% | -2.2% | 12.6% |
| MFG | 0.1% | 0.3% | 2.4% | 4.8% | 2.2% | 4.0% |
| Germany | 0.1% | -0.1% | 0.7% | 1.7% | 1.0% | 5.9% |
| ex Energy | 0.3% | 0.1% | 2.2% | 2.8% | 2.6% | 3.0% |
| Italy | 0.1% | 0.3% | 2.0% | 3.7% | 1.9% | 6.6% |
| ex Energy | 0.3% | 0.2% | 2.1% | 3.2% | 3.1% | 4.1% |
| UK | -0.6% | 0.7% | 2.6% | -2.3% | -0.1% | 8.4% |
| UK ex Energy | 0.2% | 0.4% | 2.5% | 2.7% | 3.0% | 3.0% |
| Euro Area 13 Harmonized PPI excluding Construction | ||||||
| The EA 13 countries are Austria, Belgium, Finland, France, Germany, Greece, Ireland, Italy, Luxembourg, the Netherlands, Portugal, Slovenia and Spain. | ||||||
by Robert Brusca October 12, 2007
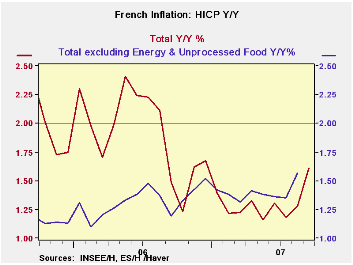
The graph on the left paints a clear picture of French inflation turning higher in September 2007. And year/year inflation did just that. Yet inflation in France is not really accelerating. The year/year jump is due to an adverse base effect - the fact that a year ago inflation had fallen making this month’s year/year a tougher comparison. When we instead look at 3-month inflation compared to 6-month inflation we see that the rate of inflation is back down from 2.7% to 1.8%.. Diffusion calculations also confirm that inflation remains under wraps. Diffusion calculates the percentage of main sectors in which inflation has accelerated in a period. What we find is that for the 3-month to 6-month inflation comparisons diffusion is 27.3 which is below the neutral level of 50. Indeed at this level we can see that inflation is in fact decelerating in many more sectors than it is accelerating. Inflation in France seems under control despite the unfortunate accompanying chart. It is more unfortunate that the chart is the main way that inflation watchers view inflation.
The table below shows the diversity in French inflation trends with one main thing in common: that inflation is mostly decelerating at least from 6 months to 3 months.Year-over-year, most sectors confirm that inflation IS higher although the headline is barely higher at 1.6% compared to 1.5% a year ago.
| France HICP and CPI details | |||||||
|---|---|---|---|---|---|---|---|
| Mo/Mo % | Saar % | Yr/Yr | |||||
| Sep-07 | Aug-07 | Jul-07 | 3-Mo | 6-Mo | 12-Mo | Yr Ago | |
| HICP Total | 0.1% | 0.3% | 0.0% | 1.8% | 2.7% | 1.6% | 1.5% |
| Core | #N/A | 0.3% | 0.0% | #N/A | #N/A | #N/A | 1.2% |
| CPI | |||||||
| All | 0.0% | 0.3% | 0.1% | 1.6% | 2.4% | 1.5% | 1.3% |
| CPI ex F&E | 0.1% | 0.4% | 0.1% | 2.2% | 2.2% | 1.5% | 1.3% |
| Food | 0.6% | 0.7% | -0.2% | 4.8% | 5.0% | 1.3% | 2.7% |
| Alcohol | 0.7% | 2.9% | 0.3% | 16.5% | 10.2% | 3.9% | 0.3% |
| Clothing & Shoes | 0.4% | 0.3% | -0.7% | -0.2% | 0.3% | 0.9% | 0.2% |
| Rent & Utilities | 0.3% | 0.1% | 0.2% | 2.5% | 3.5% | 2.7% | 3.8% |
| Health Care | 0.1% | 0.1% | 0.4% | 2.5% | 0.7% | 0.3% | 0.2% |
| Transport | 0.1% | -0.4% | 0.2% | -0.5% | 3.0% | 2.4% | 0.6% |
| Communication | 0.2% | 0.5% | 0.0% | 2.8% | 0.7% | 0.2% | -6.2% |
| Recreation & Culture | -0.7% | -0.1% | -0.2% | -3.8% | -1.8% | -1.5% | -1.6% |
| Education | -0.1% | 0.1% | 0.2% | 0.9% | 1.7% | 2.1% | 2.6% |
| Restaurant & Hotel | -1.0% | 0.8% | 0.5% | 1.3% | 2.3% | 2.8% | 2.3% |
| Other | 0.2% | 0.1% | 0.0% | 1.3% | 2.0% | 1.9% | 3.2% |
| Diffusion | 27.3% | 63.6% | 63.6% | ||||
| Type: | Diffusion Compared to | 6-mo | 12-mo | Yr-Ago | |||
by Carol Stone October 12, 2007
The awarding of the Nobel Peace Prize to Al Gore and the United Nations Intergovernmental Panel on Climate Change brings environmental issues to specific public attention once again. The news prompted us to browse Haver's offerings for information on climate and energy. We are a bit surprised, though we shouldn't be, to see how many different databases contain relevant data. Here are some select items.
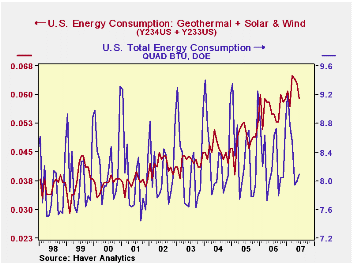
An obvious place to begin is OGJ, the Oil & Gas Journal database of its own and Department of Energy series. One section of this we haven't looked at much is "Other Energy". It includes the intriguing item "Renewable Energy Production and Consumption". The data, available through June, show that these sources constitute about 9.5% of total energy production in the US. Hydroelectric power and "wood, waste and alcohol" are most of this, at about 4-1/4% each. Other, more esoteric types are small but expanding rapidly: each geothermal and wind and solar have recently been about 0.3% of total energy production. This is a tiny fraction, but it has increased by about 75% over the past five years, with most of the advance in wind and solar.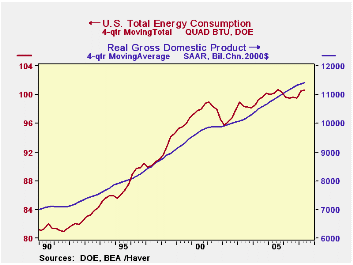
Another fact evident in the first graph here is that total energy consumption in the US has been about flat in recent periods. These data are not seasonally adjusted, but we can get around that to make our analysis more intelligible. We can aggregate the monthly energy consumption data to quarterly totals using the "A" function in the Haver DLXVG3 software and then take a 4-quarter moving total. The numerical result here is a convenient figure, right at 100 quadrillion BTU. The peak was 100.683 quads in Q3 2005; after a dip in 2006, Q2 this year was 100.637 quads. But GDP has grown over this period; in Q2 2007 its 4-quarter moving average (a figure comparable to our BTU calculation) was 4.5% higher than in Q3 2005. So the energy productivity of the economy has increased noticeably over this span: almost the same amount of energy yielded more economic activity.
We're hearing a lot about biofuels [a word, by the way, that I just added to the Microsoft Office spell-check dictionary!], and one thing we can say is that they have contributed to higher prices for grain. In the DAILY database, we find spot and futures prices for corn, and we can see plainly how they have lurched higher from about this time last year. However, the price of ethanol is yet to establish a smooth trading pattern. The futures market for it began on the Chicago Board of Trade on March 23, 2005, with the nearby (1st expiring) contract closing at $1.22/gallon. It shot up by mid-2006 to $4.23 and today closed at $1.575. Clearly, underlying supply and demand for ethanol have not gone up by three-and-a-half times and back down by two-thirds. So traders, both hedgers and speculators, have yet to find their footing in the rapidly changing economic, financial and scientific environment.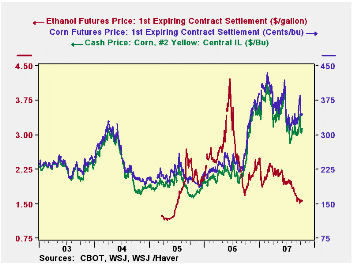
Finally, what about climate. After all, that is what concerns Mr. Gore the most. What can Haver's data tell us? We have average temperature and precipitation data, monthly back to 1921, in USECON for the "Lower 48" and in REGIONAL for individual regions and states. A quick way to see trends here is a moving average that's in a multiple of 12 months; 5 years seems easy. Looks that there's been some very slight tendency for wetter weather in the latter years and also the warming trend we hear so much about. Obviously these data just cover the US, so we can't speak here to the global situation, but the move in this country over the past 25 years seems more distinctive than might be attributable to mere chance. Being proper econometricians -- or at least cautious ones -- we'll be sure to say we haven't tested that proposition. And it would quite clearly need testing. Moreover, this only says the trend is up. It does not examine why that might be the case.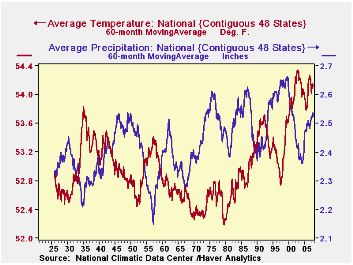
These paragraphs only scratch the surface of the information in Haver's data collections that covers environmental questions. Previous commentary here has covered miles driven and compared that to GDP growth, a result we called "driving productivity". We have seasonally adjusted some of the weekly EIA data and those are in WEEKLY. And of course, there are the highly useful Energy Intelligence databases on world oil supply and demand and natural gas weekly and monthly data. There are electric power prices in several databases. So we can help you assess numerous questions on energy, alternative energy and uses of energy and the ramifications of developments for economic growth and inflation. And you can bet our database managers will be adding more all the time. Indeed, let us know what's most important for you.

Tom Moeller
AuthorMore in Author Profile »Prior to joining Haver Analytics in 2000, Mr. Moeller worked as the Economist at Chancellor Capital Management from 1985 to 1999. There, he developed comprehensive economic forecasts and interpreted economic data for equity and fixed income portfolio managers. Also at Chancellor, Mr. Moeller worked as an equity analyst and was responsible for researching and rating companies in the economically sensitive automobile and housing industries for investment in Chancellor’s equity portfolio. Prior to joining Chancellor, Mr. Moeller was an Economist at Citibank from 1979 to 1984. He also analyzed pricing behavior in the metals industry for the Council on Wage and Price Stability in Washington, D.C. In 1999, Mr. Moeller received the award for most accurate forecast from the Forecasters' Club of New York. From 1990 to 1992 he was President of the New York Association for Business Economists. Mr. Moeller earned an M.B.A. in Finance from Fordham University, where he graduated in 1987. He holds a Bachelor of Arts in Economics from George Washington University.
More Economy in Brief


