 Global| Sep 18 2007
U.S. PPI Fell Sharply; Core Prices Tame, Food Down, Oil Cratered
by:Tom Moeller
|in:Economy in Brief
Summary
Finished producer prices fell 1.4%, the most for any month since October of last year. That followed a 0.6% increase during July and dropped the year to year percent change to 2.1%, its lowest since January. A 0.3% decline had been [...]
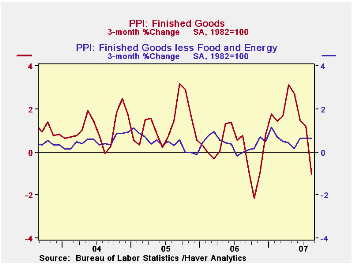
Finished producer prices fell 1.4%, the most for any month since October of last year. That followed a 0.6% increase during July and dropped the year to year percent change to 2.1%, its lowest since January. A 0.3% decline had been expected for August.
Food prices fell 0.2% (+4.7% y/y) for the fourth consecutive monthly decline led by lower prices for pork.
Energy prices cratered 6.6% after the 2.5% surge during the prior month. Gasoline prices fell 13.8% (-5.7% y/y) and home heating oil prices fell 6.0% (-4.5% y/y).Natural gas prices reversed the prior month's strength with an 8.5% decline (-4.5% y/y).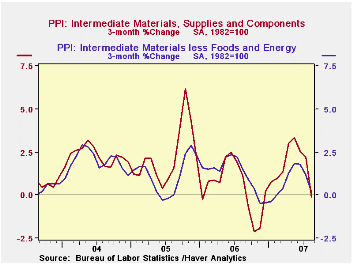
The core finished goods PPI increased a moderate 0.2% which was double the expected 0.1% uptick. The increase matched the average monthly rise of 0.2% so far this year.
Passenger car prices increased 0.5% but household furniture prices fell a modest 0.2% for the second monthly decline.
Capital equipment prices rose 0.1% for the second consecutive month. the modest increase led by a 0.9% decline in prices of light motor trucks.
Intermediate goods prices dropped 1.2% as the index excluding food & energy prices fell 0.5%, the first m/m decline since last November.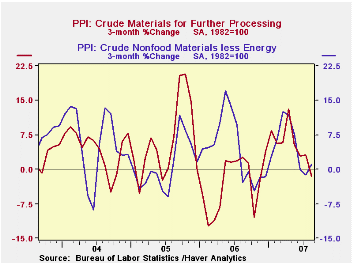
The crude materials PPI reversed all of the prior month's increase with a 3.0% drop as food prices fell 1.4%, reversing all of the prior month's increase. The core crude materials PPI jumped 1.4% on the strength of iron & steel scrap prices.
| Producer Price Index | August | July | Y/Y | 2006 | 2005 | 2004 |
|---|---|---|---|---|---|---|
| Finished Goods | -1.4% | 0.6% | 2.1% | 2.9% | 4.9% | 3.6% |
| Core | 0.2% | 0.1% | 2.2% | 1.4% | 2.4% | 1.5% |
| Intermediate Goods | -1.2% | 0.6% | 2.2% | 6.4% | 8.0% | 6.6% |
| Core | -0.5% | 0.2% | 2.5% | 6.0% | 5.5% | 5.7% |
| Crude Goods | -3.0% | 1.2% | 13.2% | 1.4% | 14.6% | 17.5% |
| Core | 1.3% | 0.0% | 13.8% | 20.9% | 4.9% | 26.5% |
by Louise Curley September 18, 2007
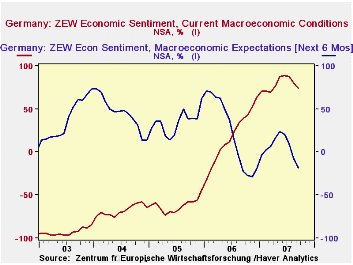
The ZEW indicator of expectations for the outlook six months ahead among institutional investors and analysts fell to -18.1% in September from -6.9% in August. This is the second month in which pessimists outnumbered optimists and is the lowest value since late 2006. The appraisal of the current situation also declined to 74.4% from 80.2%, but still showed a healthy excess of optimists over pessimists. Expectations of output six months ahead and appraisals of current conditions by the financial community are shown in the first chart.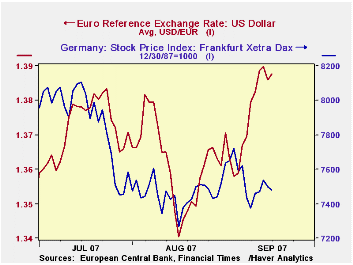
The decline in the stock market and rise in the exchange rate were, no doubt, factors that affected the opinions in the financial community. The turmoil in financial markets that has followed the emergence of trouble in the US sub prime mortgage market spread to European markets beginning in July. In Germany, the Frankfurt Xetra Dax index of stock prices has declined some 9% from the peak of July 16th. At the same time, the rise in the euro that has gained strength against the dollar and reached an all time high of $1.3886 on September 12th, has cast doubts on continued expansion in exports, a major source of growth in Germany. The courses of the stock market and the euro are shown in the second chart.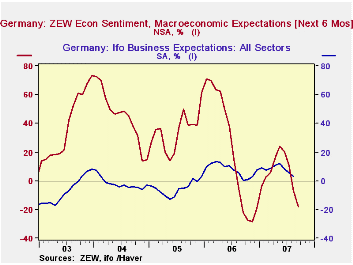
Opinions in the financial community tend to be more volatile than those of the business community as can be seen in the third chart that compares the IFO measure, based on business expectations with the ZEW measure. The IFO measure is expected to be released early in October.
| ZEW (Percent Balance) | Sep 07 | Aug 07 | Sep 06 | M/M Chg | Y/Y Chg | 2006 | 2005 | 2004 |
|---|---|---|---|---|---|---|---|---|
| Expectations 6-months Ahead | -18.1 | -6.9 | -22.2 | -11.2 | 4.1 | 22.3 | 34.8 | 44.6 |
| Current Conditions | 74.4 | 80.2 | 38.9 | -5.8 | 35.5 | 18.3 | -61.8 | -67.7 |
by Tom Moeller September 18, 2007
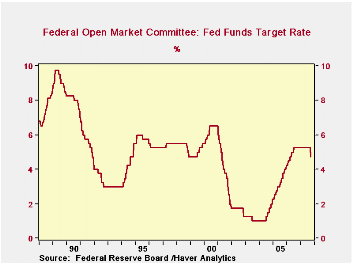
At today's Federal Open Market Committee meeting the target interest rate for Federal funds was cut by 50 basis points to 4 3/4 percent. It was the first drop in the rate since 2003.
The discount rate also was cut 50 basis points to 5 1/4 percent.
For the economy today's press release indicated worry that "the tightening of credit conditions has the potential to intensify the housing correction and to restrain economic growth more generally."
Regarding inflation the Fed indicated that "that some inflation risks remain, and (the FOMC) will continue to monitor inflation developments carefully".
The decision to lower interest rates was unanimous amongst FOMC members.
For the complete text of the Fed's latest press release please follow this link
Trend Inflation and Inflation Persistence in the New Keynesian Phillips Curve from the Federal Reserve Bank of New York can be found here.
U.S. NAHB Housing Market Index Down, Prospects Gloomyby Tom Moeller September 18, 2007
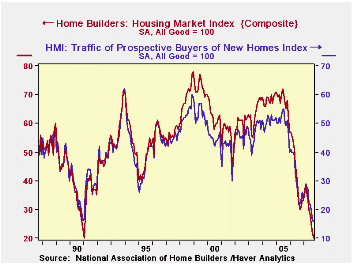
The Composite Housing Market Index from the National Association of Home Builders' (NAHB) fell 9.1% m/m to another lowest level since early 1991. The index fell to 20 in September, 49% below the high this past February. It was the seventh consecutive monthly decline.
The index fell across the country but was weakest in the West, down 18.2% m/m.
During the last twenty years there has been a 76% correlation between the y/y change in the Composite Index and the change in single family housing starts.
The sub-index from the NAHB for current sales also fell 9.1%, a full 50% below the February high.
The sub-index covering prospective sales in the next six months dropped 16.1% m/m, 51% off the high.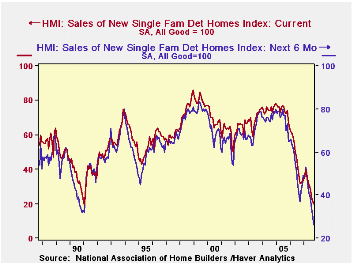
Traffic of prospective home buyers was unchanged m/m, down only 45% from the February high.
The NAHB index is a diffusion index based on a survey of builders. Readings above 50 signal that more builders view conditions good than poor.
Visit the National Association of Home Builders.
The statement from the latest FOMC meeting, where the target for the federal funds rate was cut by 50 basis points to 4 3/4 percent, is available here.
| Nat'l Association of Home Builders | September | August | Sept. '06 | 2006 | 2005 | 2004 |
|---|---|---|---|---|---|---|
| Composite Housing Market Index | 20 | 22 | 33 | 42 | 67 | 68 |
by Tom Moeller September 18, 2007
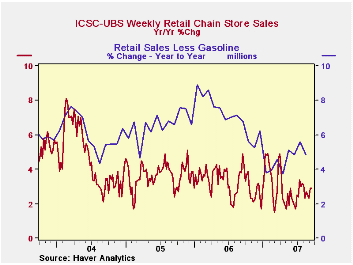
The ICSC-UBS retail chain-store sales index is constructed using the same-store sales (stores open for one year) reported by 78 stores of seven retailers: Dayton Hudson, Federated, Kmart, May, J.C. Penney, Sears and Wal-Mart.
The leading indicator of chain store sales from ICSC-UBS rose 0.4% and is up a small 0.5% y/y.
| ICSC-UBS (SA, 1977=100) | 09/15/07 | 09/08/07 | Y/Y | 2006 | 2005 | 2004 |
|---|---|---|---|---|---|---|
| Total Weekly Chain Store Sales | 480.3 | 485.6 | 2.9% | 3.3% | 3.6% | 4.7% |

Tom Moeller
AuthorMore in Author Profile »Prior to joining Haver Analytics in 2000, Mr. Moeller worked as the Economist at Chancellor Capital Management from 1985 to 1999. There, he developed comprehensive economic forecasts and interpreted economic data for equity and fixed income portfolio managers. Also at Chancellor, Mr. Moeller worked as an equity analyst and was responsible for researching and rating companies in the economically sensitive automobile and housing industries for investment in Chancellor’s equity portfolio. Prior to joining Chancellor, Mr. Moeller was an Economist at Citibank from 1979 to 1984. He also analyzed pricing behavior in the metals industry for the Council on Wage and Price Stability in Washington, D.C. In 1999, Mr. Moeller received the award for most accurate forecast from the Forecasters' Club of New York. From 1990 to 1992 he was President of the New York Association for Business Economists. Mr. Moeller earned an M.B.A. in Finance from Fordham University, where he graduated in 1987. He holds a Bachelor of Arts in Economics from George Washington University.
More Economy in Brief


