 Global| Sep 30 2004
U.S. Personal Income Up Moderately
by:Tom Moeller
|in:Economy in Brief
Summary
Personal income grew a moderate 0.4% last month following the 0.2% uptick in July that was revised slightly up. Consensus expectations had been for a 0.5% increase. Wages & salaries rose 0.4% (+4.6% y/y) and earlier months' figures [...]
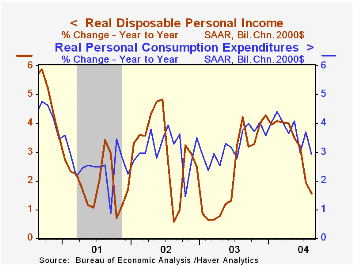
Personal income grew a moderate 0.4% last month following the 0.2% uptick in July that was revised slightly up. Consensus expectations had been for a 0.5% increase.
Wages & salaries rose 0.4% (+4.6% y/y) and earlier months' figures were revised higher. Manufacturing wages jumped 0.8% (2.6% y/y) while wages in private service producing industries rose 0.3% (5.4% y/y).
Personal disposable income rose 0.4% (3.7% y/y) and inflation adjusted disposable income rose the same 0.4% (1.6% y/y).
"Labor's Share" from the Federal Reserve Bank of St. Louis can be found here.
Consumer spending was unchanged following the upwardly revised 1.1% jump in July. Durables purchases fell due to lower light vehicle sales. Purchases of non-durable goods and services both rose a modest 0.2%.
The PCE chain price index fell slightly for the second consecutive month. Prices less food & energy also fell (+1.4% y/y) as durables prices (-0.5% m/m, -2.1% y/y) continued lower. Services prices rose just 0.1% (2.5% y/y).
| Disposition of Personal Income | Aug | July | Y/Y | 2003 | 2002 | 2001 |
|---|---|---|---|---|---|---|
| Personal Income | 0.4% | 0.2% | 5.0% | 3.2% | 1.8% | 3.5% |
| Personal Consumption | 0.0% | 1.1% | 5.1% | 5.2% | 4.6% | 4.7% |
| Savings Rate | 0.9% | 0.5% | 2.2% | 1.4% | 2.0% | 1.8% |
| PCE Chain Price Index | -0.0% | -0.0% | 2.1% | 1.9% | 1.4% | 2.1% |
by Tom Moeller September 30, 2004
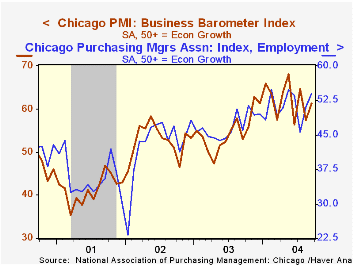
The Chicago Purchasing Managers Business Barometer for September recovered just over half of the prior month's decline with a 4.0 point gain to 61.3. Consensus expectations had been for a lesser rise to 57.5.
During the last ten years there has been a 73% correlation between the level of the Chicago Business Barometer and the three month change in factory sector industrial output. That correlation has risen to 85% during the last five years.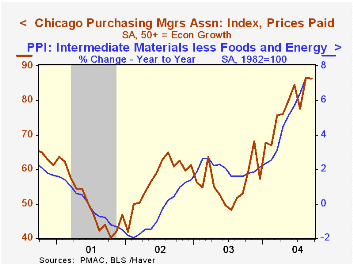
The new orders index jumped to 68.7, recovering all of the 10.7 drop in August. The employment index at 53.9, added 2.8 points to the 5.5 rise. During the last twenty years there has been an 81% correlation between the level of this employment index and the three month change in factory sector employment.
The index of prices paid remained quite firm at 86.4. During the last ten years there has been a 77% correlation between the Chicago price index and the y/y change in the "core" intermediate goods PPI.
| Chicago Purchasing Managers Index, SA | Sept | Aug | Sept '03 | 2003 | 2002 | 2001 |
|---|---|---|---|---|---|---|
| Business Barometer | 61.3 | 57.3 | 53.0 | 54.7 | 52.7 | 41.4 |
| New Orders | 68.7 | 58.0 | 54.8 | 58.0 | 56.2 | 42.3 |
| Prices Paid | 86.4 | 86.6 | 53.0 | 55.8 | 56.9 | 50.4 |
by Tom Moeller September 30, 2004
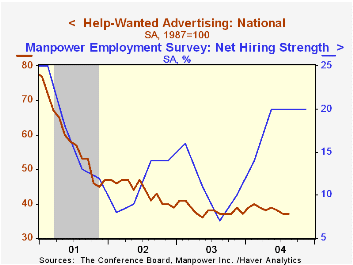
The National Index of Help-Wanted Advertising published by the Conference Board remained at 37 in August after the decline in July to the lowest level of the year.
During the last ten years there has been a 91% correlation between the level of help-wanted advertising and the year-to-year change in non-farm payrolls. The stall in help wanted indicates that most, if not all, of the y/y improvement in non-farm payroll growth has been due to fewer job losses, not improved hiring.
The proportion of labor markets with rising want-ad volume rose to 49% from a depressed 41% in July.
The Conference Board surveys help-wanted advertising volume in 51 major newspapers across the country every month.
"Why Did the Average Duration of Unemployment Become So Much Longer?" from the Federal Reserve Bank of New York is available here.
| Conference Board | Aug | July | Aug '03 |
|---|---|---|---|
| National Help Wanted Index | 37 | 37 | 37 |
by Tom Moeller September 30, 2004
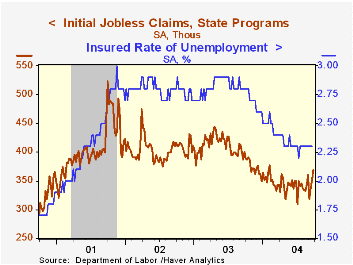
Initial claims for unemployment insurance surged another 18,000 last week to 369,000 after a 15,000 gain the prior week. Consensus expectations had been for 335,000 claims. Prior years' figures were slightly revised.
The US Labor Department indicated that last week's claims number primarily reflected hurricanes Charley, Frances and Ivan. The largest increase in initial claims for the week ending Sept. 18 was in Florida (+8,797).
The 4-week moving average of initial claims rose to 343,500 (-14.2% y/y). During the last ten years there has been an 81% (negative) correlation between the monthly average of initial claims and the y/y change in payroll employment.
Continuing claims for unemployment insurance fell 3,000.
The insured rate of unemployment remained at 2.3% where it has hovered since the end of April.
| Unemployment Insurance (000s) | 09/25/04 | 09/18/04 | Y/Y | 2003 | 2002 | 2001 |
|---|---|---|---|---|---|---|
| Initial Claims | 369 | 351 | -7.8% | 402 | 404 | 406 |
| Continuing Claims | -- | 2,873 | -20.0% | 3,531 | 3,570 | 3,018 |

Tom Moeller
AuthorMore in Author Profile »Prior to joining Haver Analytics in 2000, Mr. Moeller worked as the Economist at Chancellor Capital Management from 1985 to 1999. There, he developed comprehensive economic forecasts and interpreted economic data for equity and fixed income portfolio managers. Also at Chancellor, Mr. Moeller worked as an equity analyst and was responsible for researching and rating companies in the economically sensitive automobile and housing industries for investment in Chancellor’s equity portfolio. Prior to joining Chancellor, Mr. Moeller was an Economist at Citibank from 1979 to 1984. He also analyzed pricing behavior in the metals industry for the Council on Wage and Price Stability in Washington, D.C. In 1999, Mr. Moeller received the award for most accurate forecast from the Forecasters' Club of New York. From 1990 to 1992 he was President of the New York Association for Business Economists. Mr. Moeller earned an M.B.A. in Finance from Fordham University, where he graduated in 1987. He holds a Bachelor of Arts in Economics from George Washington University.
More Economy in Brief


