 Global| Aug 01 2006
U.S. Personal Income Up 0.6% As Expected
by:Tom Moeller
|in:Economy in Brief
Summary
Personal income rose an expected 0.6% during June following an unrevised 0.4% increase in May. Earlier data reflected benchmark revision. Wage & salary disbursements jumped 0.6% (6.9% y/y) in June following an unrevised no change the [...]
Personal income rose an expected 0.6% during June following an unrevised 0.4% increase in May. Earlier data reflected benchmark revision.
Wage & salary disbursements jumped 0.6% (6.9% y/y) in June following an unrevised no change the prior month. Strength was led by a 0.7% (7.9% y/y increase in private service-producing industry wages. Factory sector wages rose 0.3% (5.1% y/y) after an upwardly revised no change during May while earlier figures generally were revised up.
Higher interest rates boosted interest income by 1.7% (10.1% y/y) and dividend income jumped 1.0% (11.2% y/y).
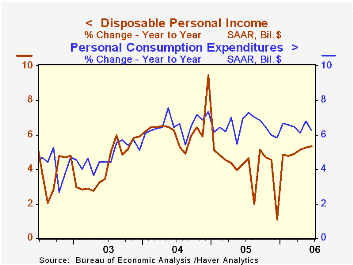
Disposable personal income increased 0.6% (5.3% y/y) after a 0.4% rise in May. Personal taxes rose 1.0% (15.4% y/y).
Adjusted for price inflation, disposable personal income rose 0.4% (1.7% y/y) after an unrevised slight decline in May. Real disposable income per capita rose 0.3% (0.8% y/y).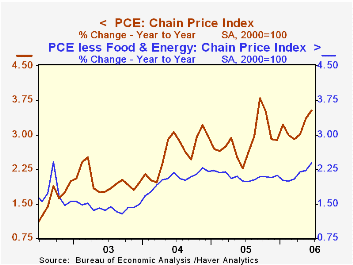
Personal consumption again matched Consensus expectations for a 0.4% rise after an upwardly revised 0.6% May rise. Adjusted for price inflation spending rose 0.2% (2.6% y/y) for the third straight month.
The PCE chain price index rose an expected 0.2%. Less food & energy prices rose 0.2% (2.4% y/y). The expected increase was the fifth in the last six months.
The personal savings rate was again negative. Should the Decline in the Personal Saving Rate Be a Cause for Concern? from the Federal Reserve Bank of Kansas City is available here.
The Anxious Index, a measure of the probability of a recession in the U.S. economy, from the Federal Reserve Bank of Philadelphia is available here.
| Disposition of Personal Income | June | May | Y/Y | 2005 | 2004 | 2003 |
|---|---|---|---|---|---|---|
| Personal Income | 0.6% | 0.4% | 6.5% | 5.2% | 6.2% | 3.2% |
| Personal Consumption | 0.4% | 0.6% | 6.2% | 6.5% | 6.6% | 4.8% |
| Savings Rate | -1.5% | -1.6% | -0.5% (June '05) | -0.4% | 2.0% | 2.1% |
| PCE Chain Price Index | 0.2% | 0.4% | 3.5% | 2.9% | 2.6% | 2.0% |
| Less food & energy | 0.2% | 0.2% | 2.4% | 2.1% | 2.0% | 1.4% |

Tom Moeller
AuthorMore in Author Profile »Prior to joining Haver Analytics in 2000, Mr. Moeller worked as the Economist at Chancellor Capital Management from 1985 to 1999. There, he developed comprehensive economic forecasts and interpreted economic data for equity and fixed income portfolio managers. Also at Chancellor, Mr. Moeller worked as an equity analyst and was responsible for researching and rating companies in the economically sensitive automobile and housing industries for investment in Chancellor’s equity portfolio. Prior to joining Chancellor, Mr. Moeller was an Economist at Citibank from 1979 to 1984. He also analyzed pricing behavior in the metals industry for the Council on Wage and Price Stability in Washington, D.C. In 1999, Mr. Moeller received the award for most accurate forecast from the Forecasters' Club of New York. From 1990 to 1992 he was President of the New York Association for Business Economists. Mr. Moeller earned an M.B.A. in Finance from Fordham University, where he graduated in 1987. He holds a Bachelor of Arts in Economics from George Washington University.
More Economy in Brief


