 Global| Sep 28 2007
U.S. Personal Income Rise of 0.3% Missed Expectations
by:Tom Moeller
|in:Economy in Brief
Summary
Personal income rose 0.3% in August after an unrevised 0.5% July increase. The latest rise lagged Consensus forecasts for a 0.4% gain and it was the weakest monthly increase since April. Much of the weakness in last month's income [...]
Personal income rose 0.3% in August after an unrevised 0.5% July increase. The latest rise lagged Consensus forecasts for a 0.4% gain and it was the weakest monthly increase since April.
Much of the weakness in last month's income gain was due to a modest rise in wages & salaries of just 0.2% (7.1% y/y) and it also was the weakest since April. Factory sector wages fell 0.1% (6.2% y/y) after a downwardly revised 0.1% July uptick.Wage & salary income in the service-producing industries also was weak and rose 0.3% (8.2% y/y) following the downwardly revised 0.5% July increase. Wages in the government sector rose 0.2% (4.0% y/y).
Interest income grew 0.7% (4.4% y/y), stronger with the rise in interest rates, and dividend income popped another 1.0% (13.7% y/y).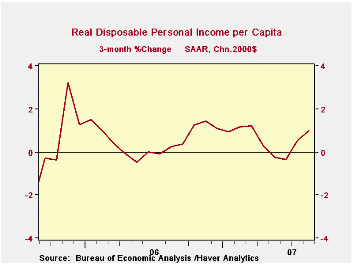
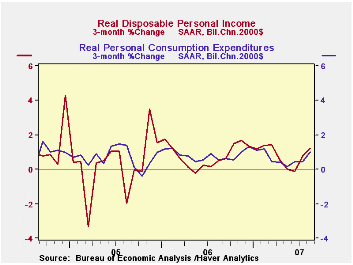
Personal current taxes rose just 0.2% but much stronger growth earlier this year pulled the y/y gain to a strong 10.8%. As a result, disposable personal income grew 0.4% (6.2% y/y), a bit below the increase in overall income, after a 0.6% July gain. Real disposable personal income rose 0.4% last month (4.4% y/y).
Personal consumption expenditures gained 0.6% last month. The increase was ahead of expectations for a 0.4% rise and was ahead of an unrevised 0.4% July gain. Durable goods purchases surged 2.4% (4.3% y/y) on the strength of a 5.4% (3.1% y/y) jump in motor vehicle outlays. Spending on furniture & other household equipment rose 0.8% (4.2% y/y) and July's increase was doubled to 1.0%. Spending on household operation jumped 2.1% (6.6% y/y) on the strength of a 4.2% (8.1% y/y) spike in electricity & gas costs. Outlays on gasoline continued to offset some of these increases with a 6.5% (-8.4% y/y) drop. Spending on apparel rose 0.5% (5.0% y/y), well below the pace of an upwardly revised 1.3% July spike, while outlays on medical care rose a steady 0.4% (6.2% y/y).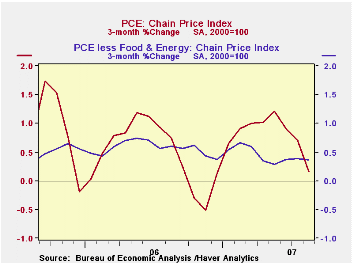
The PCE chain price index in August fell 0.1%, the first monthly decline since last October. The core PCE price index was steady at a 0.1% pace, where it has been for six months. Some of the decline in gasoline prices, which has been dampening the PCE price measure, is probably about to reverse direction with the rise in crude oil prices above $80 per barrel. However another source of price strength has been the rise in food prices, up 0.4% (4.0% y/y) in August and the annualized rate of increase so far this year is 5.4%.
The personal saving rate of 0.7% last month was fairly steady. That low figure compares to the flow of funds measure from the Federal Reserve which pegs households' net worth at nearly six times income due to the rise in real estate prices.
Can Social Security Survive the Baby Boomers? from the Federal reserve Bank of St. Louis can be found here.
| Disposition of Personal Income | August | July | Y/Y | 2006 | 2005 | 2004 |
|---|---|---|---|---|---|---|
| Personal Income | 0.3% | 0.5% | 6.8% | 6.6% | 5.9% | 6.2% |
| Personal Consumption | 0.6% | 0.4% | 5.2% | 5.9% | 6.2% | 6.4% |
| Saving Rate | 0.7% | 0.9% | -0.1% (Aug. 06) | 0.4% | 0.5% | 2.1% |
| PCE Chain Price Index | -0.1% | 0.1% | 1.8% | 2.8% | 2.9% | 2.6% |
| Less food & energy | 0.1% | 0.1% | 1.8% | 2.2% | 2.2% | 2.1% |
by Tom Moeller September 28, 2007
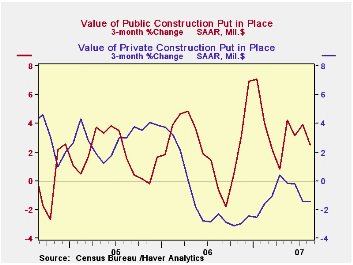
The value of construction put in place recovered 0.2% last month following a 0.5% drop during July. The rise topped consensus expectations for another decline of 0.5%.
Strength in public construction spending again provided much of the lift to overall construction spending with a 0.7% rise. Construction on highways & streets jumped 0.8% (4.2% y/y). The value of construction on highways and streets is nearly one third of the value of total public construction spending. Construction spending on education gave a real pop with a 1.3% (18.3% y/y) rise.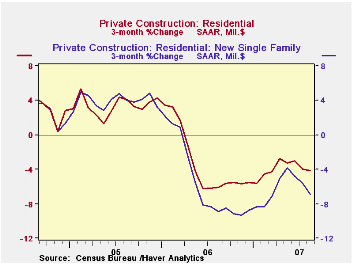
Nonresidential building jumped 2.3% after a slight dip in July. Office construction surged 3.7% (14.7% y/y) while construction in the commercial sector jumped 2.6% (14.2% y/y). It more than recovered its 1.3% July drop.
Residential building continued on the down slope and fell 1.4%. Building of new single family building fell another huge 3.3% (-25.6% y/y). Spending on improvements recovered from two months of decline with a 1.6% (1.3% y/y) increase.
During the last twenty years there has been an 84% correlation between the q/q change in the value of residential building and its contribution to growth in real GDP.
These more detailed categories represent the Census Bureau’s reclassification of construction activity into end-use groups. Finer detail is available for many of the categories; for instance, commercial construction is shown for Automotive sales and parking facilities, drugstores, building supply stores, and both commercial warehouses and mini-storage facilities. Note that start dates vary for some seasonally adjusted line items in 2000 and 2002 and that constant-dollar data are no longer computed.
Globalization, Macroeconomic Performance, and Monetary Policy is yesterday's speech by Federal Reserve Board GovernorFrederic S. Mishkin and it is available here.
| August | July | Y/Y | 2006 | 2005 | 2004 | |
|---|---|---|---|---|---|---|
| Total | 0.2% | -0.5% | -1.7% | 5.6% | 10.7% | 11.0% |
| Private | 0.0% | -1.1% | -6.1% | 4.7% | 12.0% | 13.8% |
| Residential | -1.5% | -1.7% | -16.5% | 0.5% | 13.7% | 18.7% |
| Nonresidential | 2.3% | -0.2% | 15.2% | 15.2% | 7.8% | 3.8% |
| Public | 0.7% | 1.2% | 14.7% | 9.2% | 6.2% | 1.7% |
by Tom Moeller September 28, 2007
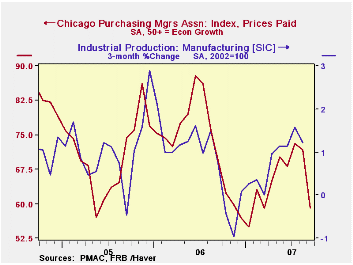
The Chicago Purchasing Manager's Association reported that its August business barometer ticked up to 53.8 after the 6.8 point collapse during July. The figure remained well below the highs of earlier this year.
During the last ten years there has been a 69% correlation between the index and the three-month change in US factory sector industrial production.
New orders recovered about half of the sharp July drop but the employment measure skidded hard. The production index dropped 3.3 points to its lowest level since May and order backlogs remained quite low.
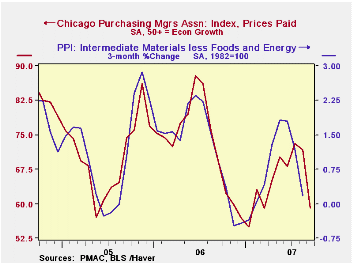
The prices paid index fell just slightly after solid gains though most of this year.During the last ten years there has been an 89% correlation between the level of the prices diffusion index and the three month change in the core PPI for intermediate goods.
| Chicago PMI | August | July | Aug. '06 | 2006 | 2005 | 2004 |
|---|---|---|---|---|---|---|
| Chicago PMI Business Barometer Index | 53.8 | 53.4 | 58.4 | 56.8 | 60.4 | 62.8 |
by Robert Brusca September 28, 2007
Sentiment fell across the EU region in September. The drop was widespread but not severe. Consumer sentiment had the lowest absolute reading but retail sentiment fell the most in September, dropping by five points. Construction sentiment bucked the trend and rose by one point. In EMU the top four countries saw sharp drops in confidence. The UK, an EU member, bucked that trend and saw sentiment rise by 1%. Across the largest EU member economies, Spain and Germany have the lowest relative sentiment readings in their ranges at 56% and 65% respectively.
Across EU it is clear that it is the consumer that is leading the slippage. The lowest relative rank among the confidence indicators is for services followed by consumer sentiment directly and by retailing. The industrial and construction readings are still above the average sentiment percentile reading for the month.
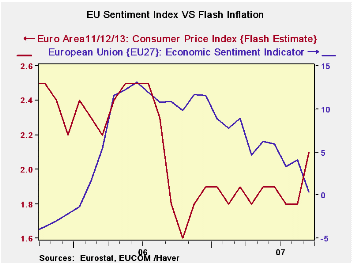
The accompanying chart shows that the slide in overall EU sentiment has been in progress for some time--since about mid-2006. It also shows that inflation has been moving lower steadily until this month when it suddenly shot up above the 2.0% ECB threshold to 2.1%.
Europe is in a dilemma. Not that 2.1% inflation is such a worry; but having inflation spurt while growth slides is a dilemma for a central bank. Since it is the first over-ceiling inflation observation in over a yea, I don’t expect the ECB to overreact to it. But the ECB has been on a bias to hike rates that it put off due to financial markets unrest and this could turn the bias into an actual rate hike. At the same the ECB must be mindful that the euro is high-valued and climbing. There has been squawking from various elements since the euro broke toward and above $1.40.
The ECB will have to puzzle out what risk it fears most. Is the strong euro enough to contain inflation and will it also cool growth obviating the need for a rate hike? Or will the ECB opt for the more direct approach and hike rates risking an even stronger move up by the euro and the risk to growth that such a move could bring?
We shall look for signs of tilting one way or the other on this issue from the various upcoming ECB spokesmen in the weeks ahead.
| EU Sectors and Country level Overall Sentiment | |||||||||||
|---|---|---|---|---|---|---|---|---|---|---|---|
| EU | Sep 07 |
Aug 07 |
Jul 07 |
Jun 07 |
%tile | Rank | Max | Min | Range | Mean | r-sq w/ Confid |
| Overall | 110.8 | 113.1 | 113.3 | 115 | 85.9 | 41 | 117 | 74 | 43 | 100 | 1.00 |
| Industrial | 3 | 5 | 5 | 7 | 88.2 | 19 | 7 | -27 | 34 | -7 | 0.90 |
| Consumer Confidence | -4 | -3 | -2 | -2 | 79.3 | 34 | 2 | -27 | 29 | -10 | 0.82 |
| Retail | 1 | 6 | 5 | 5 | 81.5 | 23 | 6 | -21 | 27 | -6 | 0.47 |
| Construction | 1 | 0 | 0 | 1 | 95.6 | 5 | 3 | -42 | 45 | -18 | 0.44 |
| Services | 20 | 22 | 20 | 21 | 68.4 | 58 | 32 | -6 | 38 | 17 | 0.80 |
| % m/m | Based on Level | Level | |||||||||
| EMU | -2.5% | -1.0% | -0.6% | -0.4% | 76.5 | 61 | 117 | 74 | 44 | 100 | 0.94 |
| Germany | -3.3% | -0.9% | -0.5% | -0.4% | 65.2 | 57 | 121 | 79 | 42 | 100 | 0.61 |
| France | -1.3% | -1.1% | 0.6% | 0.0% | 81.8 | 27 | 119 | 72 | 47 | 100 | 0.80 |
| Italy | -0.8% | -3.0% | -0.9% | -1.3% | 61.9 | 90 | 121 | 72 | 49 | 100 | 0.79 |
| Spain | -2.9% | 1.1% | -0.9% | 1.2% | 56.5 | 161 | 118 | 67 | 50 | 100 | 0.67 |
| Memo:UK | 1.1% | 4.5% | -5.7% | 1.6% | 92.9 | 6 | 119 | 69 | 50 | 101 | 0.38 |
| Since 1990 except Services(Oct 1996) | 208-Count | Services: | 126-Count | ||||||||
| Sentiment is an index, sector readings are net balance diffusion measures | |||||||||||
by Robert Brusca September 28, 2007
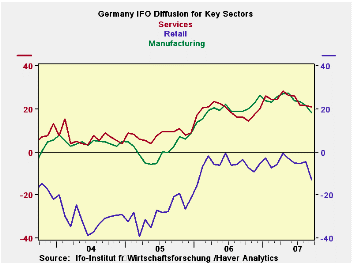
The German IFO Index shows a broad weakening in its various sector indexes. Like the EU index, the decline though broad is also slow.
The business expectations index is now only in the top one-third of its range the current situation and overall climate indexes sport readings in the low 80 percentile of their respective ranges.
For MFG the reading overall is a still strong 92 percentile for the current situation but the forward-looking readings are much deteriorated from that. Business expectations are only in the top third of the range. as is month-to-month demand and orders on hand. Foreign orders on hand remain much stronger residing in the 96th percentile of their range.
The 3-month outlook sector is relatively firm with expected MFG activity in the 80th percentile. But orders expectations have been steadily slipping and are now just above the range midpoint at 57% for retail orders. Wholesale orders expectations are firm, in the top third of their range. Export expectations are still in the low 80th percentiles – but all of these readings are slipping. Employment expectations have slipped to the bottom third of their range.
| IFO Survey: Germany | |||||||||
|---|---|---|---|---|---|---|---|---|---|
| Percent:Yr/Yr | Index Numbers | ||||||||
| sep 07 |
aug 07 |
jul 07 |
jun 07 |
may 07 |
current | average | curr /Avg |
%tile | |
| Biz Climate | -0.9% | 0.7% | 0.8% | 0.2% | 2.8% | 104.2 | 95.7 | 108.9% | 81.0% |
| Current Situation | -1.3% | 2.4% | 2.4% | 1.6% | 4.7% | 109.9 | 94.8 | 115.9% | 83.2% |
| Biz Expectations: Next6-Mos | -0.4% | -1.1% | -0.9% | -1.2% | 1.0% | 98.7 | 96.7 | 102.1% | 69.1% |
| Manufacturing: | sep 07 |
aug 07 |
jul 07 |
jun 07 |
may 07 |
current | average | curr /Avg |
%tile |
| Current Situation | |||||||||
| MFG | 0.8% | 4.4% | 4.5% | 4.4% | 6.7% | 110.3 | 92.3 | 119.5% | 92.8% |
| Biz Expectations: Next 6-Mos | |||||||||
| MFG | -1.4% | -1.9% | -0.4% | -2.8% | 0.9% | 97.0 | 96.5 | 100.6% | 66.1% |
| Activity (m/m) | |||||||||
| MFG | -4.5% | 1.0% | -1.9% | -3.7% | 2.0% | 102.9 | 97.0 | 106.1% | 77.8% |
| Demand M/M | |||||||||
| MFG | -6.3%> | -2.8% | -3.3% | -7.1% | 0.5% | 100.3 | 97.1 | 103.3% | 65.6% |
| Orders on hand | |||||||||
| MFG | -4.7% | -2.4% | -2.8% | -3.6% | -0.9% | 101.2 | 96.4 | 104.9% | 69.0% |
| Foreign orders on hand | |||||||||
| MFG | 0.5% | 2.5% | 1.9% | 2.0% | 2.5% | 111.3 | 94.5 | 117.8% | 96.0% |
| Yr/Yr percentage changes in underlying Indexes | |||||||||
| IFO outlook for 3-Months ahead | |||||||||
| 3-Mos ahead | Percent: Yr/Yr | Index Numbers | |||||||
| Expected Activity | sep 07 |
aug 07 |
jul 07 |
jun 07 |
may 07 |
current | average | curr/ Avg |
%tile |
| MFG | -0.9% | 2.4% | 1.0% | 3.3% | 0.5% | 100.3 | 96.8 | 103.7% | 80.6% |
| Orders expectations | |||||||||
| Retail Orders Expectations | -1.8% | -10.5% | -11.7% | -10.9% | -4.7% | -18.0 | -17.6 | 102.2% | 57.3% |
| Wholesale | -0.1% | 7.7% | 7.0% | 5.6% | 15.7% | -1.1 | -13.9 | 7.9% | 67.1% |
| EXPORT Biz Expectations | |||||||||
| MFG | -1.4% | 0.9% | 0.0% | 0.5% | -0.5% | 102.3 | 98.4 | 103.9% | 83.0% |
| Employment Expectations | |||||||||
| MFG | 4.1% | 4.1% | 7.4% | 8.4% | 7.5% | 104.5 | 96.0 | 108.8% | 33.3% |

Tom Moeller
AuthorMore in Author Profile »Prior to joining Haver Analytics in 2000, Mr. Moeller worked as the Economist at Chancellor Capital Management from 1985 to 1999. There, he developed comprehensive economic forecasts and interpreted economic data for equity and fixed income portfolio managers. Also at Chancellor, Mr. Moeller worked as an equity analyst and was responsible for researching and rating companies in the economically sensitive automobile and housing industries for investment in Chancellor’s equity portfolio. Prior to joining Chancellor, Mr. Moeller was an Economist at Citibank from 1979 to 1984. He also analyzed pricing behavior in the metals industry for the Council on Wage and Price Stability in Washington, D.C. In 1999, Mr. Moeller received the award for most accurate forecast from the Forecasters' Club of New York. From 1990 to 1992 he was President of the New York Association for Business Economists. Mr. Moeller earned an M.B.A. in Finance from Fordham University, where he graduated in 1987. He holds a Bachelor of Arts in Economics from George Washington University.
More Economy in Brief


