Global| Mar 31 2006
U.S. Personal Income Gain Light
by:Tom Moeller
|in:Economy in Brief
Summary
Personal income rose 0.3% during February, a gain that fell just short of Consensus expectations for a 0.4% increase though the firm 0.7% January advance was unrevised. Wage & salary disbursements continued firm with a 0.4% (5.1% y/y) [...]
Personal income rose 0.3% during February, a gain that fell just short of Consensus expectations for a 0.4% increase though the firm 0.7% January advance was unrevised.
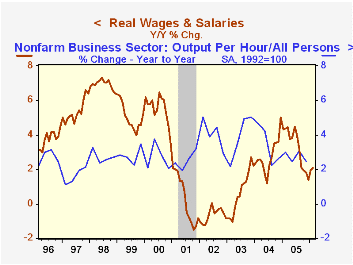
Wage & salary disbursements continued firm with a 0.4% (5.1% y/y) increase. Factory sector wages rose 0.2% (2.9% y/y) after an upwardly revised 0.3% January gain and the rise in service sector wages halved to 0.4% (5.4% y/y) after a 0.8% jump during January.Wages adjusted for price inflation during the last twelve months rose 2.1%, a deceleration from the 2005 advance. Last year, real wage growth of 3.3% just outpaced the 2.7% gain in worker productivity.
Disposable personal income increased 0.2% (5.1% y/y) after an upwardly revised 0.6% January increase. Adjusted for price inflation disposable income rose 0.2% (2.2% y/y). Real disposable income per capita increased 0.1% (1.3% y/y).Personal consumption rose 0.1%, a bit more than the Consensus expectation for no change. In real terms, a 2.1% (-4.6% y/y) drop in motor vehicles & parts held back the advance but spending on furniture & household equipment fell just 1.6% (+10.5% y/y) after a 4.4% January boom that was double the gain initially estimated. Spending on clothing & shoes gave back all of the downwardly revised January gain with a 1.1% (+4.1% y/y) decline. Real services spending rose 0.8% (3.0% y/y). Spending on household services & operation recovered 5.3% m/m as temperatures turned more normal.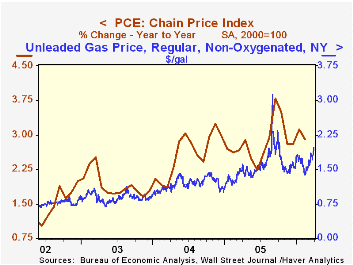
The PCE chain price index was unchanged as gasoline & oil prices fell 0.9% (21.4% y/y) though in March the wholesale price of gasoline has surged. Prices for clothing & shoes dropped 1.0% (-2.2% y/y) during February and furniture & household equipment prices fell another 0.3% (-4.2% y/y).
Incentives and Prices for Motor Vehicles: What has been happening in recent years? is a Working Paper from the Federal Reserve Board and is available here.
The personal savings rate was negative for the tenth month in the last eleven.
Temptation and Self-Control: Some Evidence and Applications from the Federal Reserve Bank of Minneapolis can be found here.
| Disposition of Personal Income | Feb | Jan | Y/Y | 2005 | 2004 | 2003 |
|---|---|---|---|---|---|---|
| Personal Income | 0.3% | 0.7% | 5.6% | 5.5% | 5.9% | 3.2% |
| Personal Consumption | 0.1% | 0.8% | 6.2% | 6.5% | 6.5% | 4.9% |
| Savings Rate | -0.5% | -0.5% | 0.5% (Feb '05) | -0.4% | 1.7% | 2.1% |
| PCE Chain Price Index | 0.0% | 0.5% | 2.9% | 2.8% | 2.6% | 1.9% |
| Less food & energy | 0.1% | 0.2% | 1.8% | 2.0% | 2.0% | 1.3% |

Tom Moeller
AuthorMore in Author Profile »Prior to joining Haver Analytics in 2000, Mr. Moeller worked as the Economist at Chancellor Capital Management from 1985 to 1999. There, he developed comprehensive economic forecasts and interpreted economic data for equity and fixed income portfolio managers. Also at Chancellor, Mr. Moeller worked as an equity analyst and was responsible for researching and rating companies in the economically sensitive automobile and housing industries for investment in Chancellor’s equity portfolio. Prior to joining Chancellor, Mr. Moeller was an Economist at Citibank from 1979 to 1984. He also analyzed pricing behavior in the metals industry for the Council on Wage and Price Stability in Washington, D.C. In 1999, Mr. Moeller received the award for most accurate forecast from the Forecasters' Club of New York. From 1990 to 1992 he was President of the New York Association for Business Economists. Mr. Moeller earned an M.B.A. in Finance from Fordham University, where he graduated in 1987. He holds a Bachelor of Arts in Economics from George Washington University.
More Economy in Brief