 Global| Feb 01 2007
U.S. Personal Income Firm, Core Prices Tame
by:Tom Moeller
|in:Economy in Brief
Summary
Personal income increased 0.5% after two months of 0.3% rise and matched Consensus expectations. For the year, income rose 6.4%, faster than the 5.2% gain during 2005. Wages & salaries jumped 0.6% (6.4% y/y) and for the whole year [...]
Personal income increased 0.5% after two months of 0.3% rise and matched Consensus expectations. For the year, income rose 6.4%, faster than the 5.2% gain during 2005.
Wages & salaries jumped 0.6% (6.4% y/y) and for the whole year rose 6.6% after the 5.1% increase during 2005. Last year's gain was the strongest since 2000. Factory sector wages made up for the prior month's slip with a 0.2% (3.8% y/y) increase. The full year gain of 4.7% also was the strongest since 2000. Wages in the private service-producing industries rose a strong 0.8% (7.0% y/y) and for the year rose 7.2%.
Interest income declined 0.4% (+3.0% y/y) for the third consecutive month and earlier months' gains were revised away. Dividend income surged 1.1% (11.7% y/y) for the fourth month and for the year rose 11.3%.
Disposable personal income advanced 0.5% (5.2% y/y), better than the 0.3% increase during November and for the year rose 5.5%. Personal taxes increased 0.7% (10.9% y/y) and for the year rose 13.3%. Real disposable personal income rose 0.2% (2.9% y/y) last month and for the year rose 2.7%. Real disposable income per capita rose 1.8% last year, up from the 0.2% gain during 2005.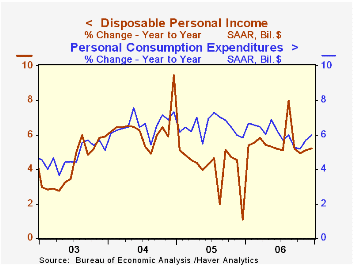
Personal consumption surged 0.7% last month after an unrevised 0.5% gain during November and matched expectations. Last month's gain was helped by a 4.4% (-2.1% y/y) increase in unit auto sales. That lowered the year's gain in spending to 6.0% from 6.5% during 2005. Spending on nondurables grew 1.6% last month and 7.0% for the year but adjusted for higher prices nondurables spending grew just 0.6% in December and 3.8% last year. Real consumer spending rose 0.3% after a 0.5% November gain and grew 3.2% for the year, down from 3.5% during 2005.
The personal savings rate was a more negative -1.2% during December and in 2006 averaged -1.0%. Should the Decline in the Personal Saving Rate Be a Cause for Concern? from the Federal Reserve Bank of Kansas City is available here.
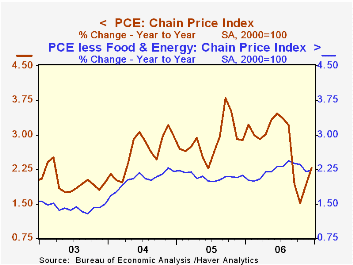
The PCE chain price index rose a firm 0.4% due to a 3.7% gain in gasoline prices which has since more than reversed. Prices less food & energy ticked up 0.1% after no change in November. The three month change in core prices fell to 1.7% (AR), the lowest since February.
| Disposition of Personal Income | December | November | Y/Y | 2006 | 2005 | 2004 |
|---|---|---|---|---|---|---|
| Personal Income | 0.5% | 0.3% | 5.9% | 6.4% | 5.2% | 6.2% |
| Personal Consumption | 0.7% | 0.5% | 6.0% | 6.0% | 6.5% | 6.6% |
| Savings Rate | -1.2% | -1.0% | -0.3% (Dec. '05) | -1.0% | -0.4% | 2.0% |
| PCE Chain Price Index | 0.4% | 0.0% | 2.3% | 2.8% | 2.9% | 2.6% |
| Less food & energy | 0.1% | 0.0% | 2.2% | 2.2% | 2.1% | 2.0% |
by Tom Moeller February 1, 2007
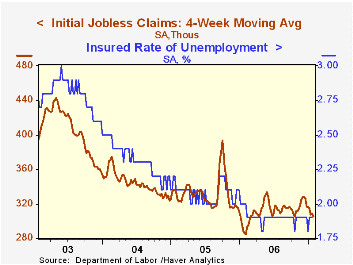
A 20,000 drop in initial unemployment insurance claims last week to 307.000 reversed half of the upwardly revised increase the prior week. Consensus expectations had been for 315,000 claims.
During the last ten years there has been a (negative) 77% correlation between the level of initial claims and the m/m change in nonfarm payroll employment.
The four-week moving average of initial claims fell to 304,750 (6.6% y/y).
Continuing claims for unemployment insurance jumped 71,000 (1.1% y/y).
The insured rate of unemployment remained at 1.9%, about where it's been since February.
| Unemployment Insurance (000s) | 01/27/07 | 01/20/07 | Y/Y | 2006 | 2005 | 2004 |
|---|---|---|---|---|---|---|
| Initial Claims | 307 | 327 | 8.1% | 313 | 332 | 343 |
| Continuing Claims | -- | 2,484 | -3.2% | 2,459 | 2,662 | 2,924 |
by Carol Stone (for Tom Moeller) February 1, 2007
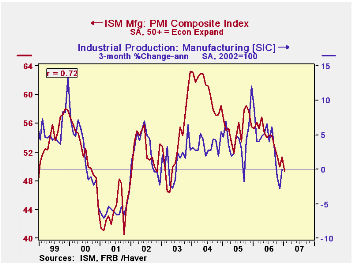
The ISM Manufacturing Index fell back below 50 in January to 49.3, reversing December's gain and confounding forecasts of a further gain to over 51. Readings above 50 indicate that activity is expanding at half or more of the responding companies, taken to mean that the manufacturing sector is generally growing. Thus, the January figure just below 50 describes a basically flat pattern for the month, taking account of seasonal adjustment.
The change in the index was driven by inventories, which plunged from December's 48.5 to 39.9. This is the lowest reading since February 2002 and the sharpest month-on-month drop since July/August 1984. It indicates that manufacturers are reducing their holdings of materials and supplies. This item has only a 10% weight in the composite index, but the size of the decline means it reduced the index by 0.84 point.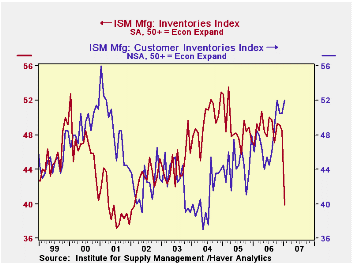
Production was the next largest contributing factor, decreasing 2.8 points to 49.6. It has a 25% weight, so it took 0.7 point away from the total index.
New orders were also weaker, but much more modestly, downshifting to 50.3 from 51.9 in December. This has the largest weight in the index calculation, 30%, and thus subtracted 0.48 from the total. Supplier deliveries are still positive, but less so, easing from 53.3 to 52.7 in January. This means that activity at vendors is moderating so fewer companies face protracted waiting times for deliveries of supplies.
Employment actually moved favorably, from 49.4 in December to 49.5 in January. The tiny improvement indicates that employment is falling at fewer companies, and indeed, with the reading so close to 50%, it is best described as "steady".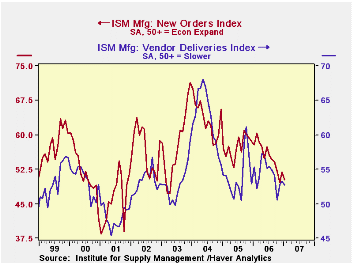
Prices paid by survey participants rebounded in January to 53.0 from 47.5 in December, largely recouping that month's decline. The press release from the Institute of Supply Management reports that aluminum, nickel and stainless steel went up in price, along with corn products. Copper, resins, natural gas and basic steel were all down. Note that the index is based on the number of companies reporting higher prices, not the number of commodities or materials with higher prices.
Finally among survey items of note this month, companies reported that their customers' inventories rose further to 52.6 from 50.5. This measure has been above 50 for four months, but before October, had been below 50 since the middle of 2001. This item is read negatively: more survey respondents in January judged that their customers stocks' are excessive, suggesting that those customers could cut back on future orders.
Taken together, this ISM report portrays a flat manufacturing sector, with little change in activity and sharp inventory reductions. A slowing in activity was indicated by industrial production data through December, and this ISM report implies that has carried forward into early 2007.
| ISM Manufacturing Survey | Jan 2007 | Dec 2006 | Nov 2006 | Jan 2006 | 2006 | 2005 | 2004 |
|---|---|---|---|---|---|---|---|
| Composite Index | 49.3 | 51.4 | 49.9 | 55.3 | 53.9 | 55.5 | 60.5 |
| Prices Index (NSA) | 53.0 | 47.5 | 53.5 | 65.0 | 65.0 | 66.4 | 79.8 |
Tom Moeller
AuthorMore in Author Profile »Prior to joining Haver Analytics in 2000, Mr. Moeller worked as the Economist at Chancellor Capital Management from 1985 to 1999. There, he developed comprehensive economic forecasts and interpreted economic data for equity and fixed income portfolio managers. Also at Chancellor, Mr. Moeller worked as an equity analyst and was responsible for researching and rating companies in the economically sensitive automobile and housing industries for investment in Chancellor’s equity portfolio. Prior to joining Chancellor, Mr. Moeller was an Economist at Citibank from 1979 to 1984. He also analyzed pricing behavior in the metals industry for the Council on Wage and Price Stability in Washington, D.C. In 1999, Mr. Moeller received the award for most accurate forecast from the Forecasters' Club of New York. From 1990 to 1992 he was President of the New York Association for Business Economists. Mr. Moeller earned an M.B.A. in Finance from Fordham University, where he graduated in 1987. He holds a Bachelor of Arts in Economics from George Washington University.
More Economy in Brief
 Global| Feb 05 2026
Charts of the Week: Balanced Policy, Resilient Data and AI Narratives
by:Andrew Cates


