 Global| Aug 07 2008
U.S. Pending Home Sales Unexpectedly Rose
by:Tom Moeller
|in:Economy in Brief
Summary
The National Association of Realtors reported that the June level of pending sales of existing homes rose 5.3%. That reversed the 4.9% decline during May which was unrevised. The latest increase compared to Consensus expectations for [...]
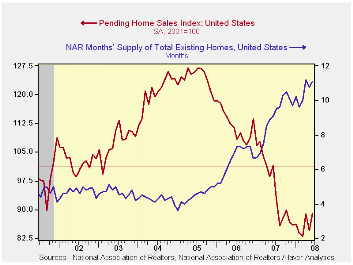
The National Association of Realtors reported that the June level of pending sales of existing homes rose 5.3%. That reversed the 4.9% decline during May which was unrevised. The latest increase compared to Consensus expectations for a 1.0% drop.
These figures are analogous to the new home sales data from
the Commerce Department in that they measure existing home sales when
the sales contract is signed, not at the time the sale is closed. The
series dates back to 2001.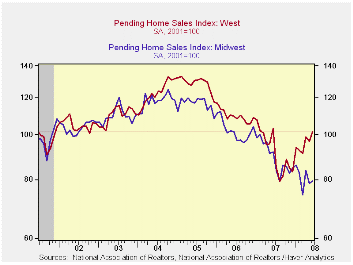
The regional sales figures indicated that sales in the South recovered all of their May decline with a 9.3% increase while sales in the Northeast nearly recovered two months of decline with a 3.4% rise. Sales in the Midwest posted a weak 1.3% rise on the heels of a 6.0% May drop and sales in the West continued to recover. They posted a 4.6% gain to the highest level in twelve months.
The Realtors association indicated in an earlier report that the number of homes on the market & available for sale ticked up a not seasonally adjusted 0.2% (2.8% y/y) after a 1.5% decline during May.
At the current sales rate there was an 11.1 months' supply of homes on the market versus an 8.9 months' average during all of last year, a 6.5 months' supply in 2006 and a 4.5 months' supply in 2005.
The pending home sales data are available in Haver's PREALTOR database and the number of homes on the market are in the REALTOR database.
Rational Real Estate from the Federal Reserve Bank of Richmond can be found here.
| Pending Home Sales (2001=100) | June | May | Y/Y | 2007 | 2006 | 2005 |
|---|---|---|---|---|---|---|
| Total | 89.0 | 84.5 | -12.2% | 95.7 | 112.1 | 124.3 |
| Northeast | 79.6 | 77.0 | -15.4 | 85.6 | 98.5 | 108.3 |
| Midwest | 79.6 | 78.6 | -13.3 | 89.6 | 102.0 | 116.4 |
| South | 92.4 | 84.5 | -16.6 | 107.3 | 127.3 | 134.8 |
| West | 101.0 | 96.6 | -1.8 | 92.1 | 109.5 | 128.6 |
by Tom Moeller August 7, 2008
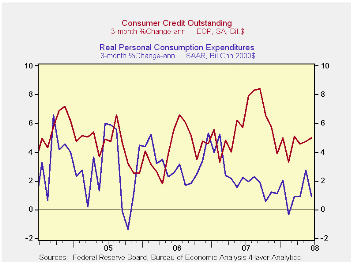
Consumer credit outstanding rose $14.3B during June following moderate $8.0 and $9.0 billion increases during the prior two months.
On a percentage basis, the change in consumer credit over the
last three months averaged 5.0% (AR) and that was roughly stable. The
rate of gain was, however, up from 3.3% this passed February.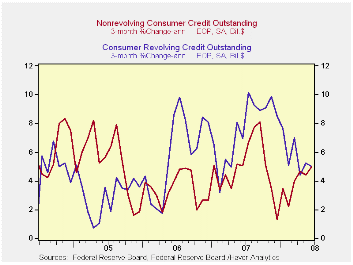
Revolving credit outstanding rose $5.5B during June. Here again, the three month rate of growth of 5.0% recently has been stable but reduced from a 7.4% rise during all of last year.
Non-revolving credit, which accounts for nearly two thirds of total consumer credit, rose a sharp $8.9B in June. The three month annualized average growth rate, however, was 5.0% and that was up from a 2.2% growth rate in February, 4.7% growth during all of last year and 3.6% growth in 2004.
These figures are the major input to the Fed's Flow of Funds accounts for the household sector, released quarterly.
Credit card debt and payment use from the Federal Reserve Bank of Boston can be found here.
| Consumer Credit (m/m Chg, SAAR) | June | May | Y/Y | 2007 | 2006 | 2005 |
|---|---|---|---|---|---|---|
| Total | $14.3B | $8.0B | 5.6% | 5.7% | 4.5% | 4.3% |
| Revolving | $5.5B | $6.1B | 7.2% | 7.4% | 6.1% | 3.1% |
| Non-revolving | $8.9B | $1.9B | 4.6% | 4.7% | 3.6% | 4.9% |
by Tom Moeller August 7, 2008
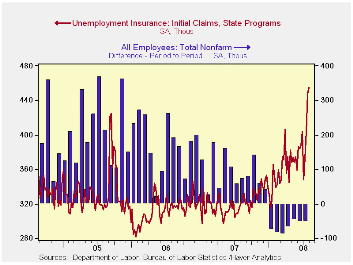
Initial claims for unemployment insurance rose again last week. The 7,000 increase to 455,000 followed the unrevised 45,000 surge during the week earlier. The latest level was the highest since March of 2002 and it surpassed Consensus expectations for a decline to 420,000 claims.
The Labor Department indicated that a program to locate people eligible for jobless benefits played a role in last week's increase in claims.
As a result of the latest jump in initial claims, the
four-week moving average increased to 419,500 (34.5% y/y), the highest
level since mid-2003. During July claims averaged 393,000.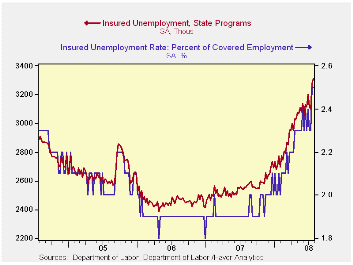
A claims level below 400,000 typically has been associated with growth in nonfarm payrolls. During the last ten years there has been a (negative) 76% correlation between the level of initial claims and the m/m change in nonfarm payroll employment. Over the longer period of time, the level of claims for jobless insurance has not trended higher with the size of the labor force due to a higher proportion of self-employed workers who are not eligible for benefits.
Continuing claims for unemployment insurance during the latest week rose 31,000 after a little revised 183,000 jump during the prior week. The four-week moving average of continuing claims surged to 3,201 which was its highest level since late-2003.
Continuing claims provide some indication of workers' ability to find employment and they lag the initial claims figures by one week.
The insured rate of unemployment was stable at 2.5%, the highest level since early 2004.
How Much Have U.S. House Prices Fallen from the Federal Reserve Bank of St. Louis is available here.
Unanchored Expectations? Interpreting the Evidence from Inflation Surveys from the Federal Reserve Bank of San Francisco can be found here.
| Unemployment Insurance (000s) | 08/02/08 | 07/26/08 | Y/Y | 2007 | 2006 | 2005 |
|---|---|---|---|---|---|---|
| Initial Claims | 455 | 448 | 43.1% | 322 | 313 | 331 |
| Continuing Claims | -- | 3,311 | 29.7% | 2,552 | 2,459 | 2,662 |
by Robert Brusca August 7, 2008
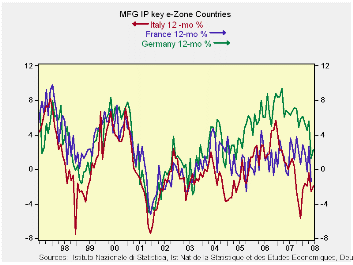
Weakness in industrial output is now a growing EU-wide
phenomenon based on the large countries’ results. Among the early
reporting large countries Germany, Italy and the UK show negative
growth rates for real output in 2008-Q2. Only Spain with an
exceptionally wild output series shows a gain in Q2 and that is after
seeing output lower over six months and over 12-months.
Frances results are plotted in the chart above but they lack a
timely update for June. Still the pattern in output is clear. Germany
is having the sharpest current drop. Italy has had the longest period
in which output has been declining (Yr/Yr). France had not had the
degree of output success of the others earlier in the expansion. It has
showed better resilience to declining forces than Italy over the past
year and has only just dropped to show Yr/Yr declines in output.
The services sectors of these countries are showing weakened
performance as well although the monthly report for EMU showed a bit of
resilience. Inflation still dogs Europe – regardless of the domain of
the central bank.
While the authorities in Japan have just opened the door to admitting
weakness and have gone so far as to admit that the economy could be in
recession even now, in the Europe a certain confidence is still exuded,
but by increasingly cautious policymakers. Today, German banking
association president Klaus-Peter Mueller said that there is no end in
sight for financial crisis. 2008 will remain a difficult year for all
banks he says. With banks so impeded and the ECB acting slowly (it
refrained from any rate changes at today’s meeting) Europe is going to
be under increasing downward pressure. The steady decline in the value
of the euro exchange rate speaks to what risks that have put in play.
| Main E-zone Countries and UK IP in MFG | ||||||||||
|---|---|---|---|---|---|---|---|---|---|---|
| Mo/Mo | Jun 08 |
May 08 |
Jun 08 |
May 08 |
Jun 08 |
May 08 |
||||
| MFG Only | Jun 08 |
May 08 |
Apr 08 |
3Mo | 3Mo | 6mo | 6mo | 12mo | 12mo | Q-2 -Date |
| Germany: | 0.5% | -1.9% | -0.3% | -6.9% | -9.2% | -2.2% | -0.8% | 2.2% | 1.3% | -6.1% |
| France: IP excl Construction | #N/A | -2.6% | 1.5% | #N/A | -8.8% | #N/A | -1.7% | #N/A | -1.2% | #N/A |
| Italy | 0.2% | -1.5% | 0.4% | -3.3% | -4.9% | 1.5% | 1.1% | -2.0% | -2.6% | -2.5% |
| Spain | -4.9% | -14.8% | 27.5% | 13.9% | -33.7% | -17.5% | -10.0% | -9.6% | -7.7% | 2.2% |
| UK | -0.5% | -0.6% | 0.0% | -4.2% | -4.2% | -1.5% | -1.0% | -1.3% | -0.9% | -2.9% |
by Robert Brusca August 7, 2008
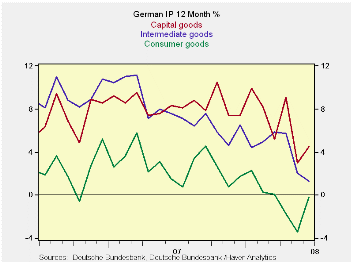 Larger order drop points to
even worse performance in Q3.
Larger order drop points to
even worse performance in Q3.
Trends in German output are losing momentum across all sectors despite a small rebound in the current month. Consumer goods output has been weakening for some time but the softening in capital goods output is a relatively new phenomenon.>
Output of consumer goods and capital goods rose in June after falling sporadically in earlier months intermediate goods output that feeds both sectors, is simply declining. The sequential growth rates in the table show that that the annual rate of decline is becoming progressively weaker in the more recent periods- indicating cumulating weakness across sectors.
In the quarter-to-date (now a complete Q2, but not yet fully revised Q2), IP is dropping at a 6.4% pace led by a weak consumer sector (-9.7%) MFG output is dropping at a 6.1% pace. MFG orders are dropping at an even sharper 15.4% pace in the quarter, an ominous sign for Q3.
| Total German IP | |||||||
|---|---|---|---|---|---|---|---|
| Saar except m/m | Jun-08 | May-08 | Apr-08 | 3-mo | 6-mo | 12-mo | Quarter -to-Date |
| IP total | 0.2% | -1.8% | -0.2% | -7.2% | -2.3% | 1.6% | -6.4% |
| Consumer Goods | 1.0% | -0.3% | -3.0% | -8.9% | -5.8% | -0.2% | -9.7% |
| Capital Goods | 1.4% | -3.7% | 2.7% | 1.5% | 2.1% | 4.5% | -4.3% |
| Intermediary Goods | -0.6% | -1.0% | -1.9% | -12.9% | -4.5% | 1.3% | -6.1% |
| Memo | |||||||
| Construction | -2.1% | 2.4% | -3.5% | -12.3% | -6.4% | 0.2% | -28.8% |
| MFG IP | 0.5% | -1.9% | -0.3% | -6.9% | -2.2% | 2.2% | -6.1% |
| MFG Orders | -2.9% | -1.4% | -1.7% | -21.7% | -14.6% | -8.4% | -15.4% |

Tom Moeller
AuthorMore in Author Profile »Prior to joining Haver Analytics in 2000, Mr. Moeller worked as the Economist at Chancellor Capital Management from 1985 to 1999. There, he developed comprehensive economic forecasts and interpreted economic data for equity and fixed income portfolio managers. Also at Chancellor, Mr. Moeller worked as an equity analyst and was responsible for researching and rating companies in the economically sensitive automobile and housing industries for investment in Chancellor’s equity portfolio. Prior to joining Chancellor, Mr. Moeller was an Economist at Citibank from 1979 to 1984. He also analyzed pricing behavior in the metals industry for the Council on Wage and Price Stability in Washington, D.C. In 1999, Mr. Moeller received the award for most accurate forecast from the Forecasters' Club of New York. From 1990 to 1992 he was President of the New York Association for Business Economists. Mr. Moeller earned an M.B.A. in Finance from Fordham University, where he graduated in 1987. He holds a Bachelor of Arts in Economics from George Washington University.
More Economy in Brief


