 Global| Dec 10 2007
U.S. Pending Home Sales Ticked Higher, Again
by:Tom Moeller
|in:Economy in Brief
Summary
For October, the National Association of Realtors reported that the level of pending home sales ticked 0.6% higher after a modest 1.4% rise during the prior month. The level of sales still is 18.4% below October of last year and 23.0% [...]
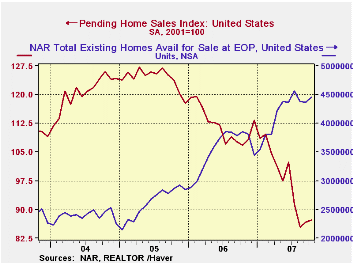
For October, the National Association of Realtors reported that the level of pending home sales ticked 0.6% higher after a modest 1.4% rise during the prior month. The level of sales still is 18.4% below October of last year and 23.0% year to date. The last two months are the first back to back gains since early last year.
The latest monthly figure is about one third below the peak level during the Summer of 2005. The data date back only to 2001.
These figures are analogous to the new home sales data from the Commerce Dept. They measure existing home sales when the sales contract is signed, not at the time the sale is closed.
The Realtors also indicated in an earlier report that the
number of homes on the market and available for sale rose 1.9% in
October after two months of moderate decline. The rise was to a level
of 445,300 units, double the level at the low in early 2005.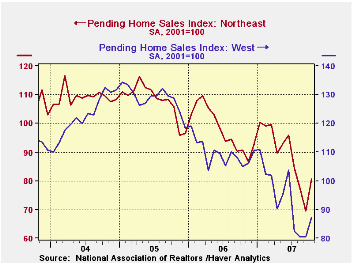
In the Northeast, pending home sales rose 6.0% m/m and recouped all of a September decline. The rise, however, followed two months a sharp drop so sales remained 20% lower than at the start of the year. Sales in the Western part of the nation also posted an 8.7% m/m rise but remained off 21% from the level early in the year.
Sales in the rest of the country were down in October. In the Midwest sales fell a slight 1.4% to remain 17% below early this year. In the South sales fell another 7.8% to a level that was 31% from the early year high.
The pending home sales data are available in Haver's PREALTOR database and the number of homes on the market are in the REALTOR database.
Housing Woes Weigh Heavily on the Economy from the Federal Reserve Bank of St. Louis can be found here.
| Pending Home Sales (2001=100) | October | September | Y/Y | 2006 | 2005 | 2004 |
|---|---|---|---|---|---|---|
| Total | 87.2 | 86.7 | -18.4% | 112.1 | 124.2 | 120.5 |
| Northeast | 80.6 | 69.5 | -11.1 | 98.0 | 108.0 | 109.2 |
| Midwest | 85.5 | 86.7 | -11.7 | 102.0 | 116.4 | 118.0 |
| South | 91.6 | 99.3 | -25.3 | 127.4 | 134.8 | 126.6 |
| West | 87.3 | 80.5 | -16.9 | 109.6 | 128.7 | 122.7 |
by Robert Brusca December 10, 2007
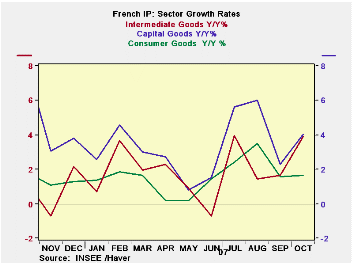
Industrial production in France was up strongly in October
showing a rise of 2.1%. In the past three months overall output is up
but without any real strong sector leadership. Auto sales are up
strongly in October. In the quarter to date output is up strongly over
its Q3 level expanding at an 8.1% annual rate. France follows the same
trend as Germany as its consumer goods output is lagging, falling by
2.1% so far in Q3. Capital goods output is up at a 6.9% annual rate in
Q4. Europe continues to show weak consumer demand/output and displays
an ongoing strong capital goods sector.
| French IP excluding Construction | ||||||
|---|---|---|---|---|---|---|
| Saar exept m/m | Oct-07 | Sep-07 | Aug-07 | 3-mo | 6-mo | 12-mo |
| IP total | 2.1% | -1.2% | 0.1% | 3.9% | 5.7% | 4.0% |
| Consumer goods | 0.4% | -1.5% | 0.9% | -1.1% | 3.3% | 1.6% |
| Capital goods | 1.0% | -1.0% | -0.1% | -0.3% | 7.0% | 4.0% |
| Intermediate goods | 1.9% | -0.9% | -0.6% | 1.6% | 3.5% | 3.9% |
| Memo | ||||||
| Auto | 6.9% | -4.0% | 1.3% | 16.5% | 6.9% | 5.7% |
by Robert Brusca December 10, 2007
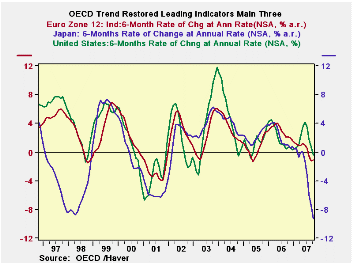
The MAIN OECD LEIs (leading economic Indicators, trend
adjusted) are dropping at a faster pace over the recent three months.
Japan’s drop is the sharpest. The OECD itself pushes emphasis on the
6-month changes in these indexes. On that basis the OECD, the OECD main
seven OECD Europe, Japan and the US all are declining. The US move is
the least negative. Japan’s is the most. Europe's slide is a bit less
than for the OECD overall.
Still the message from these OECD LEIs is very clear. The area
is slowing. The OECD itself flags Japan as a worrisome case and talks
of moderate slowing elsewhere. Clearly financial markets and central
bank events can have an influence on events in these various countries
and regions. The outlook remains in flux since these indicators have
worsened since last month.
| OECD Leading Indicators by Main regions/countries | ||||||
|---|---|---|---|---|---|---|
| Oct-07 | Sep-07 | Aug-07 | 3-Mo | 6-Mo | 12-Mo | |
| OECD | -0.3% | -0.4% | -0.7% | -5.1% | -2.0% | -0.1% |
| OECD Big 7 | -0.5% | -0.5% | -0.8% | -7.0% | -2.9% | -1.5% |
| OECD Europe | 0.0% | -0.3% | -0.5% | -3.1% | -1.5% | -0.8% |
| OECD Japan | -1.4% | -1.2% | -1.6% | -15.7% | -11.5% | -11.7% |
| OECD US | -0.5% | -0.4% | -0.7% | -6.0% | -0.7% | 1.6% |
by Robert Brusca December 10, 2007
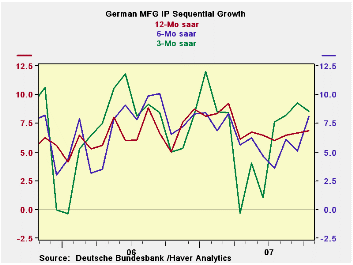
German IP edged lower in October in the face of a spurt in
orders for the month that was dominated by bulk orders. Still with the
-0.3% October result German IP is entering the new quarter on an up
note. Q/Q calculations are concerned with comparing the average level
of IP in the current quarter to the average level in the previous
quarter. The spurt for IP in August and small the rise in September
still leave the level of IP in October, after its fall, above the Q3
average. IP is growing at annual rate of 2.6% entering Q4. Consumer
goods output is much weaker, up at just a 0.4% pace in Q4. As has been
the case capital goods output is up a strong 14.3% at an annual rate.
Intermediate output is off at a 2.2% pace. Ex construction, IP is
rising at nearly a nine percent annual rate.
So Germany continues to be a bit of a conundrum. The trends in
the chart show that no direction is really dominant. The sectors are
moving in different directions, too. We know the strong euro is
creating problems; we are unsure how many. Germany remain a bit of an
enigma.
| Total German IP | ||||||
|---|---|---|---|---|---|---|
| Saar exept m/m | Oct-07 | Sep-07 | Aug-07 | 3-mo | 6-mo | 12-mo |
| IP total | -0.3% | 0.1% | 1.9% | 7.1% | 7.5% | 5.9% |
| Consumer goods | -1.3% | 0.1% | 4.2% | 12.0% | 0.4% | 3.0% |
| Capital goods | 2.1% | -0.5% | 1.6% | 13.4% | 13.4% | 10.4% |
| Intermediary goods | -1.0% | 0.2% | 1.5% | 2.9% | 6.9% | 5.6% |
| Memo | ||||||
| Construction | 0.2% | 0.7% | 2.0% | 12.6% | 4.3% | -0.8% |

Tom Moeller
AuthorMore in Author Profile »Prior to joining Haver Analytics in 2000, Mr. Moeller worked as the Economist at Chancellor Capital Management from 1985 to 1999. There, he developed comprehensive economic forecasts and interpreted economic data for equity and fixed income portfolio managers. Also at Chancellor, Mr. Moeller worked as an equity analyst and was responsible for researching and rating companies in the economically sensitive automobile and housing industries for investment in Chancellor’s equity portfolio. Prior to joining Chancellor, Mr. Moeller was an Economist at Citibank from 1979 to 1984. He also analyzed pricing behavior in the metals industry for the Council on Wage and Price Stability in Washington, D.C. In 1999, Mr. Moeller received the award for most accurate forecast from the Forecasters' Club of New York. From 1990 to 1992 he was President of the New York Association for Business Economists. Mr. Moeller earned an M.B.A. in Finance from Fordham University, where he graduated in 1987. He holds a Bachelor of Arts in Economics from George Washington University.
More Economy in Brief


