 Global| Jul 09 2009
U.S. Pays $8 Billion In Unemployment Benefits
by:Tom Moeller
|in:Economy in Brief
Summary
The current recession started over eighteen months ago and roughly eight billion dollars are being paid each month in unemployment benefits under state programs. For the jobless who have exhausted their unemployment benefits, recent [...]
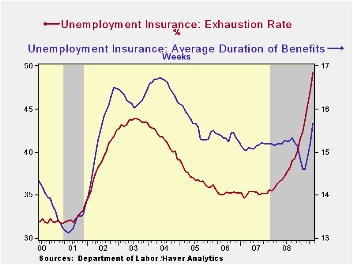
The current recession started over eighteen months ago and roughly eight billion dollars are being paid each month in unemployment benefits under state programs. For the jobless who have exhausted their unemployment benefits, recent discussion in Washington of extending the duration of benefits may come too late. For those receiving benefits, the news is welcome in this tough job environment. Data in Haver's USECON database focuses on the magnitude of the labor market difficulties, not only by dollars paid and the duration of unemployment but by which industries and states have been most affected.
The average duration of unemployment recently has been running 15.7
weeks. That is up by one full week from the beginning of the year and,
given the severity of this recession, it likely will rise further.
During the severe recessions of 1973-75 and 1981-82, the peaks in
average duration were above 17 weeks. Notable this cycle has been the
jump in the benefit exhaustion rate to a record 49.2%. (The exhaustion
rate is the percent of claimants who collect all of their
unemployment.) Past cycle highs were nearer to 40%. As this recession
has now lasted so long, the higher rate is no surprise. The states with
the higher benefit exhaustion rates include New Jersey (57.3%),
California (55.5%), Massachusetts (48.8%) and New York (46.5%). (These
figures are available in Haver's REGIONAL database.)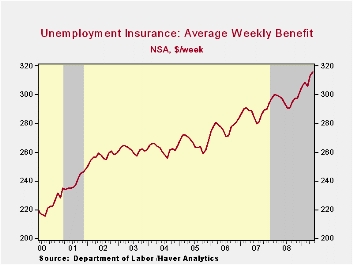
Also under current discussion is raising the level of weekly dollars paid in insurance. The current average of $315.71 is up 6.2% from last year and up from an average $212.13 ten years ago. Adjusted for inflation using the CPI, benefits have risen 18% over those ten years helped by the recent decline in oil prices.
The industry breakout of continued unemployment claims indicates that roughly one-third of all continuing unemployment insurance benefits are being collected by workers in the manufacturing (20.3%) and construction (13.6%) industries. The factory sector's share of all claims being paid is up to 20% from 13% early last year. The administration & support sectors follow with 10.0% of workers collecting, but that rate has been stable since 2005. The retail trade sector follows with a steady 8.0% collecting while 5.4% of workers in the professional/scientific and tech services area collect. Surprisingly, perhaps, workers in the health care & social services industry account for 4.7% of those collecting, but that is down from an 8.0% 2007 peak. Finally, 3.0% of workers in the finance & insurance industries collect but that is down from a 4.8% share late in 2007.
The elasticity of the unemployment rate with respect to benefits from the Federal Reserve Bank of Philadelphia can be found here.
| Unemployment Insurance Benefits | May | April | May '08 | 2008 | 2007 | 2006 |
|---|---|---|---|---|---|---|
| Average Duration (Weeks) | 15.68 | 15.21 | 15.18 | 15.19 | 15.14 | 15.38 |
| Exhaustion Rate (%) | 49.23 | 47.06 | 36.80 | 37.84 | 35.22 | 35.42 |
U.S. Initial Claims For Unemployment Insurance Fall Sharply But Continuing Claims Reach A New Record
by Tom Moeller July 9, 2009
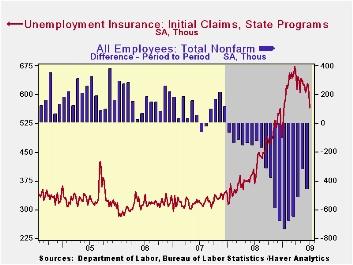
The labor market may have given another sign of improvement in the U.S. economy. Initial claims for unemployment insurance fell a surprisingly sharp 52,000 last week to 565,000 after a slightly revised 13,000 decline during the prior week. The latest level was off from the March peak of 674,000 and it was the lowest level since mid-January. The four-week average of claims, which smoothes out some of the volatility in the weekly numbers, also fell to 606,000. The latest weekly level was quite a bit lower than Consensus expectations for 610,000.
The Labor Department indicated that the largest increases in initial claims for the week ending June 27 were in New Jersey (+7,876), Massachusetts (+4,730), Kansas (+4,469), Kentucky (+3,614), and New York (+3,019), while the largest decreases were in Florida (-12,493), Illinois (-5,321), Pennsylvania (-3,949), California (-2,919), and Tennessee (-2,743).
Continuing claims for unemployment insurance jumped 159,000 to a new
record high, though these figures do lag the initial claims by one
week. Continuing claims provide an indication of workers' ability to
find employment. At 6,883,000 claims were more than double the year ago level. The four-week average of continuing claims also touched a new record high. The series dates back to 1966.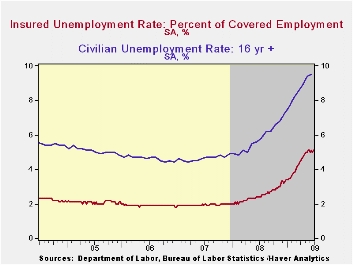
The insured rate of unemployment inched up just slightly to 5.1%, essentially where it has been for the last eight weeks. It was, however, the highest rate since 1983. During the last ten years there has been a 93% correlation between the level of the insured unemployment rate and the overall rate of unemployment published by the Bureau of Labor Statistics.
The highest insured unemployment rates in the week ending June 20 were in Michigan (6.8 percent), Puerto Rico (6.8), Oregon (6.7), Pennsylvania (6.4), Nevada (6.2), Wisconsin (5.7), California (5.3), Illinois (5.3), North Carolina (5.3), and South Carolina (5.3).
The unemployment insurance claims data is available in Haver's WEEKLY database and the state data is in the REGIONW database.
Federal Reserve's Initiatives to Support Minority-Owned Institutions is the title of today's speech by Fed Governor Elizabeth A. Duke and it can be found here.
| Unemployment Insurance (000s) | 07/04/09 | 06/27/09 | 06/20/09 | Y/Y | 2008 | 2007 | 2006 |
|---|---|---|---|---|---|---|---|
| Initial Claims | 565 | 617 | 630 | 54.0% | 420 | 321 | 313 |
| Continuing Claims | -- | 6,883 | 6,724 | 113.9% | 3,342 | 2,552 | 2,459 |
Consumer Credit Usage Falls For An Unprecedented Fourth Straight Month
by Tom Moeller July 9, 2009
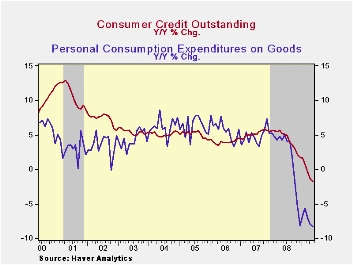
The consumer continued to deleverage this spring. The Federal Reserve reported late yesterday that consumer credit outstanding during May fell for the fourth straight month and for the eighth month since last summer. The $3.3B decline was the shallowest of the unprecedented streak, but it followed huge double-digit drops during the prior three months. The decline in credit usage has been just one factor behind the recent retrenchment in retail spending though the May drop was short of expectations for a $7.1B decline.
Usage of revolving credit fell a sharp $2.9B during May following an even sharper decline of $8.7B during April. The latest was the eighth decline in as many months and it lowered usage by 3.6% versus one year ago. Non-revolving credit (autos & other consumer durables), which accounts for nearly two-thirds of the total, ticked lower by $0.4B in May but the decline was quite a bit shallower than during the prior two months. Compared to the decline in revolving credit usage, the drop here has been less dramatic. The 0.7% y/y shortfall compares to a 6.8% drop after the 1990-91 recession but it is similar to the pullbacks during 1975 and even the "credit crunch" recession of 1980.
These figures are the major input to the Fed's quarterly Flow of Funds accounts for the household sector.
Credit data are available in Haver's USECON database. The Flow of Funds data are in Haver's FFUNDS database.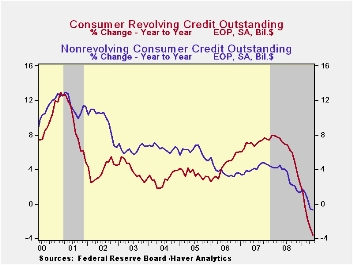
Commercial real estate is the topic of today's testimony by Jon D. Greenlee, Associate Director, Division of Banking Supervision and Regulation at the Federal Reserve and it can be found here.
| Consumer Credit (m/m Chg, SAAR) | May | April | Y/Y | 2008 | 2007 | 2006 |
|---|---|---|---|---|---|---|
| Total | $-3.3B | $-16.5B | -1.8% | 1.7% | 5.5% | 4.5% |
| Revolving | $-2.9B | $-8.7B | -3.6% | 2.3% | 7.4% | 6.1% |
| Non-revolving | $-0.4B | $-7.8B | -0.7% | 1.4% | 4.4% | 3.6% |
UK Trade Picture: Better In Month But In Flux
by Robert Brusca July 9, 2009
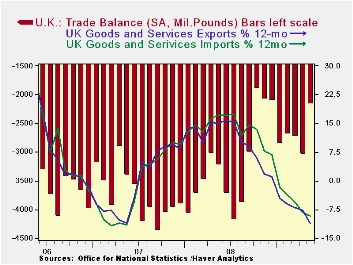
The UK trade balance shrank to 6.26bln sterling in May from 7.14bln
in April. Exports edged lower, while imports fell by 4% in May. Export
and import trends do not show very dramatic signs of change. Exports
are declining by a bit less than imports and their rate of decline is
more persistently losing that negative edge, but that remains a very
gradual process. For imports the declines over various horizons are
still large. The pace of decline over three months is less than for six
months; the drop over six months shows acceleration in the drop
compared to 12 months. Import trends are still a chaotic.
Exports and imports of road vehicles have picked up, perhaps in
response to various vehicle purchase plans in effect in the UK and
around Europe. Vehicle sales have picked up because of such incentives.
Trends for capital goods shipments are worsening for exports and for imports over 12- 6- and 3-months.
For other groups of exports and imports the patterns are still too varying to categorize.
German trade reported a bounce in exports with imports still falling
in May. German orders (especially foreign orders) and industrial output
have been on the mend in other recent reports. Still, it is too soon to
throw the UK figures in with that lot and call them positive. The UK
trade accounts still have divergent trends and the improvement in trade
has given way to deterioration and then to more improvement. It is too
much in flux to be sure of. Both export and import trends are still
under clear downward pressure Yr/Yr. There is no solid sign of trade
flows returning to an expansion path any time soon for the UK.
| m/m% | % Saar | ||||
| May-09 | Apr-09 | 3M | 6M | 12M | |
| Balance* | -££ 6.26 | -££ 7.14 | -££ 6.62 | -££ 6.89 | -££ 7.34 |
| Exports | |||||
| All Exp | -0.8% | -1.5% | -12.3% | -13.7% | -14.1% |
| Capital gds | -2.8% | -8.0% | -34.3% | -28.1% | -16.1% |
| Road Vehicles | 14.5% | -8.3% | -10.6% | -39.8% | -35.0% |
| Basic Materials | -22.2% | 11.6% | -33.3% | -3.6% | -44.4% |
| Food Feed Bev & Tbco | -0.6% | 4.2% | 11.9% | 17.5% | 9.2% |
| IMPORTS | |||||
| All IMP | -4.0% | 1.5% | -16.1% | -20.1% | -15.3% |
| Capital gds | -7.5% | -0.7% | -42.6% | -37.1% | -19.9% |
| Road Vehicles | 5.5% | -5.6% | -9.4% | -22.5% | -38.4% |
| Basic Materials | -2.0% | -2.0% | -16.5% | -39.8% | -36.2% |
| Food Feed Bev & Tbco | -2.1% | 5.5% | 8.2% | 5.7% | 9.3% |
| *Stg Blns; mo or period average | |||||

Tom Moeller
AuthorMore in Author Profile »Prior to joining Haver Analytics in 2000, Mr. Moeller worked as the Economist at Chancellor Capital Management from 1985 to 1999. There, he developed comprehensive economic forecasts and interpreted economic data for equity and fixed income portfolio managers. Also at Chancellor, Mr. Moeller worked as an equity analyst and was responsible for researching and rating companies in the economically sensitive automobile and housing industries for investment in Chancellor’s equity portfolio. Prior to joining Chancellor, Mr. Moeller was an Economist at Citibank from 1979 to 1984. He also analyzed pricing behavior in the metals industry for the Council on Wage and Price Stability in Washington, D.C. In 1999, Mr. Moeller received the award for most accurate forecast from the Forecasters' Club of New York. From 1990 to 1992 he was President of the New York Association for Business Economists. Mr. Moeller earned an M.B.A. in Finance from Fordham University, where he graduated in 1987. He holds a Bachelor of Arts in Economics from George Washington University.
More Economy in Brief


