 Global| Aug 04 2006
U.S. Payrolls & Wages Moderate
by:Tom Moeller
|in:Economy in Brief
Summary
July nonfarm payrolls rose 113,000 and the increase fell short of Consensus expectations for a 142,000 gain. Revisions increased slightly the rise in June payrolls to 124,000 and the rise in May payrolls to 100,000. Year to date [...]
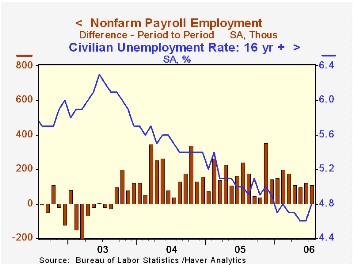
July nonfarm payrolls rose 113,000 and the increase fell short of Consensus expectations for a 142,000 gain. Revisions increased slightly the rise in June payrolls to 124,000 and the rise in May payrolls to 100,000.
Year to date payrolls have risen an average 140,000 per month versus an average of 165,000 last year and an average 175,000 during 2004.
Average hourly earnings rose the same 0.4% as a downwardly revised 0.4% June gain but exceeded expectations for a 0.3% rise. The increase in factory sector earnings moderated to 0.1% (1.5% y/y) from the 0.2% increase in June.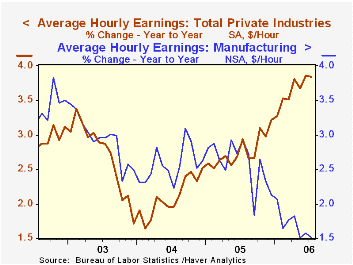
From the household survey the unemployment rate rose to 4.8% versus an expected 4.6%. It was the highest level since February and the increase reflected a 34,000 (+1.6% y/y) decline in employment which followed a 387,000 jump during June. The labor force rose 213,000 (1.3% y/y) as the labor force participation rate remained up at 66.2% though the rate for adult males stayed low at 75.7%. The participation rate for females over 20 rose to a three year high of 60.8%.
The breadth of one month gain in private payrolls fell sharply to 53.2% in July, the lowest since last September. In the factory sector the one month breadth of gain fell to a less-than break even 45.2%.
Factory sector payrolls reversed most of the prior month's gain with a 15,000 decline. Jobs in the computer & electronic products industry fell 8,200 (+0.2% y/y) and the number of motor vehicle & parts jobs fell 7,900 (+0.4% y/y). 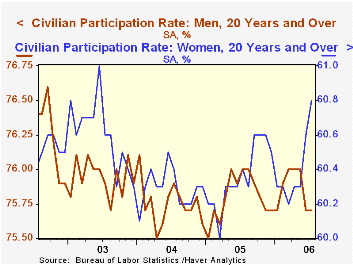
Private service-producing jobs rose 115,000 (1.5% y/y), improved from an upwardly revised 86,000 June increase. Retail trade sector jobs continued weak and were unchanged (-0.6% y/y) after several months of decline. Financial sector jobs rose 6,000 (2.2% y/y) and professional & business services employment rose 43,000 (2.7% y/y). Temporary help services jobs fell for the fifth month this year, by 2,400 (+3.1% y/y). Jobs in education & health services rose 24,000 (2.1% y/y).
Construction employment rose 6,000 (3.0% y/y) following two months of moderate decline. Year to year growth in residential construction jobs moderated further to 2.9% from the peak of 6.0% last year and 7.0% during 2004. Growth in nonresidential construction jobs picked up to 5.5% from 1.7% last year and negative growth in 2004.
The workweek remained elevated at 33.9 hours in private industry versus the 2Q level of 33.9.
Click here for The Unemployment Effects of Proposed Changes in Social Security's "Normal Retirement Age." This paper was published by the National Association for Business Economics (www.nabe.com) in the April 2006 issue of the NABE journal Business Economics.
Participation Dynamics: The More, the Merrier is from the Federal Reserve Bank of St. Louis and it can be found here.
| Employment | July | June | Y/Y | 2005 | 2004 | 2003 |
|---|---|---|---|---|---|---|
| Payroll Employment | 113,000 | 124,000 | 1.3% | 1.5% | 1.1% | -0.3% |
| Manufacturing | -15,000 | 22,000 | 0.1% | -0.6% | -1.3% | -4.9% |
| Average Weekly Hours | 33.9 | 33.9 | 33.8 (July '05) | 33.8 | 33.7 | 33.7 |
| Average Hourly Earnings | 0.4% | 0.4% | 3.8% | 2.8% | 2.1% | 2.7% |
| Unemployment Rate | 4.8% | 4.6% | 5.0% (July '05) | 5.1% | 5.5% | 6.0% |
by Carol Stone August 4, 2006
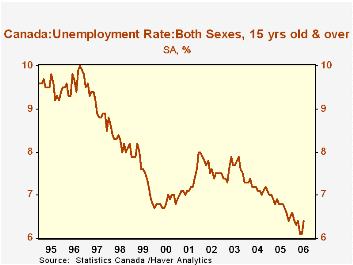
We last wrote about the Canadian labor force four months ago and we extolled the 31-year low in unemployment, 6.3% in March. After an uptick in April, the rate dropped to another 31-year low of 6.1% in both May and June. But July saw it climb back to 6.4%. Part of the rise is explained by an increase in participation, particularly among women. This increase in the number of people willing to work met with a modest decrease in employment by 5,500 after a 4,600 loss in June. The resulting employment rate (employment as a % of population) fell to 63.0%, the lowest since April.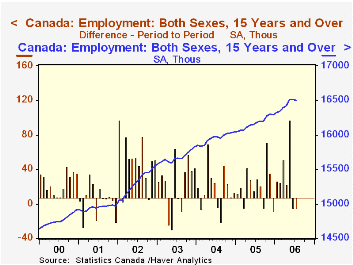
The press reports note that the fall in employment and the rise in unemployment were not expected and are therefore very dramatic. But these developments come in the wake of an extraordinary employment gain of 96,700 in May. That was the second largest monthly increase since 1976, with the largest in this span just a bit more, 97,000, in January 2002. So it is hard not to expect some pause to follow that big move. And what we have in these two latest months is minuscule, 0.03% each time, so it's more that employment stabilized rather than "falling".
In the big May rise, several industry groups participated, particularly finance and related services, health care and public administration. There were also notable gains in professional services, culture & recreation and accommodations & food services. In the subsequent months, only one, professional services, lost all of its May increase. Others grew in at least one of June or July; accommodation and food services increased in both. The total services sector grew 1.1% in the last three months and is up 2.9% over a year ago.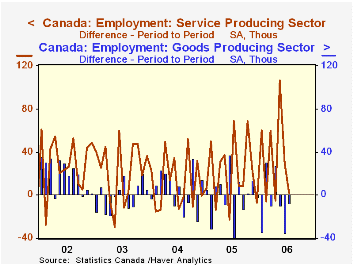
Goods-producing industries are not so strong, as a brief flurry in manufacturing back in the spring faded quickly. Mining and construction have stronger trends, but mining is small -- roughly 325,000 employees all together -- so 7% growth there over a year ago doesn't add many total workers. Construction has more impact, though, and it too is up more than 7% year-on-year, adding almost 72,000 workers. So there is diverse growth in Canadian employment opportunities and a two-month pause hardly indicates that these gains have stopped in their tracks.
| Canada (Seasonally Adjusted) | Jul 2006 | June 2006 | May 2006 | Year Ago | 2005 | 2004 | 2003 |
|---|---|---|---|---|---|---|---|
| Unemployment Rate (%) | 6.4 | 6.1 | 6.1 | 6.8 | 6.8 | 7.2 | 7.6 |
| Participation Rate (%) | 67.3 | 67.2 | 67.3 | 67.2 | 67.2 | 67.5 | 67.5 |
| Employment (Change, 000s/%) | -5.5 | -4.6 | +96.7 | 2.0% | 1.4% | 1.8% | 2.4% |
| Goods-Producing | -7.4 | -34.7 | -9.8 | -0.6% | 0.2% | 1.7% | 1.2% |
| Service-Producing | +1.8 | +30.2 | +106.4 | 2.9% | 2.1% | 1.8% | 2.7% |

Tom Moeller
AuthorMore in Author Profile »Prior to joining Haver Analytics in 2000, Mr. Moeller worked as the Economist at Chancellor Capital Management from 1985 to 1999. There, he developed comprehensive economic forecasts and interpreted economic data for equity and fixed income portfolio managers. Also at Chancellor, Mr. Moeller worked as an equity analyst and was responsible for researching and rating companies in the economically sensitive automobile and housing industries for investment in Chancellor’s equity portfolio. Prior to joining Chancellor, Mr. Moeller was an Economist at Citibank from 1979 to 1984. He also analyzed pricing behavior in the metals industry for the Council on Wage and Price Stability in Washington, D.C. In 1999, Mr. Moeller received the award for most accurate forecast from the Forecasters' Club of New York. From 1990 to 1992 he was President of the New York Association for Business Economists. Mr. Moeller earned an M.B.A. in Finance from Fordham University, where he graduated in 1987. He holds a Bachelor of Arts in Economics from George Washington University.
More Economy in Brief


