 Global| Apr 07 2006
U.S. Payrolls Up, Unemployment Down
by:Tom Moeller
|in:Economy in Brief
Summary
Non-farm payrolls increased 211,000 during March. The gain beat Consensus expectations for a 190,000 rise but the February & January advances were both revised down slightly. Since payrolls started rising in early 2003 employment [...]
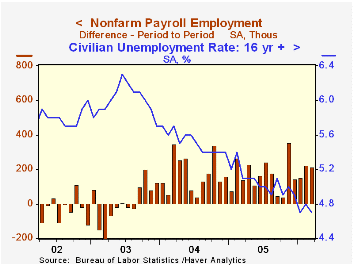
Non-farm payrolls increased 211,000 during March. The gain beat Consensus expectations for a 190,000 rise but the February & January advances were both revised down slightly. Since payrolls started rising in early 2003 employment growth has averaged 1.5% at an annual rate.
From the household survey the unemployment rate fell back to 4.7%. Employment surged 384,000 (2.2% y/y) and the labor force rose 203,000 (1.6% y/y). Consensus expectations had been for an unchanged unemployment rate at 4.8%.
Since early 2003, the household survey's measure of employment growth has averaged 1.7% (AR).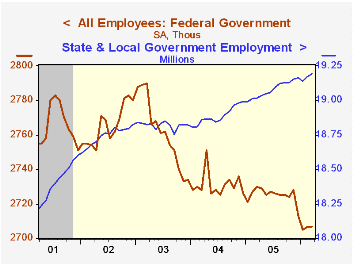
The gain in construction employment slowed to 7,000 (4.3% y/y) during March following increases the prior two months which were helped by warm winter temperatures and averaged 41,000.
Jobs in private service-producing industries rose 178,000 (1.8% y/y). Jobs in retail trade rose a firm 29,400 (0.9% y/y) though motor vehicle dealers' employment fell and financial sector jobs rose 16,000 (2.3% y/y). Professional & business services employment rose 52,000 (2.8% y/y) while jobs in education & health rose 33,000 (2.4% y/y). Leisure & hospitality employment increased 42,000 (2.2% y/y).
Factory sector payrolls fell another 5,000 after a deepened 10,000 worker decline during February. Employment in the motor vehicles & parts industries fell 1,900 (-2.9% y/y) after a 14,900 February drop. The breadth of gain in factory payrolls over the last three months fell to a 45.2%, indicating broad based job loss.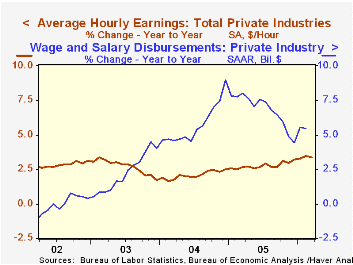
Government employment rose 24,000 (0.7% y/y) though hiring by the federal government was unchanged (-0.8% y/y). During the last three years the number of federal government jobs has fallen 3.0% but during the same period state & local hiring is up 2.0%
The 0.2% gain in average hourly earnings was half the February rate increase.
Currents and Undercurrents: Changes in the Distribution of Wealth, 1989-2004 from the Federal Reserve Board is available here.
| Employment | Mar | Feb | Y/Y | 2005 | 2004 | 2003 |
|---|---|---|---|---|---|---|
| Payroll Employment | 211,000 | 225,000 | 1.6% | 1.5% | 1.1% | -0.3% |
| Manufacturing | -5,000 | -10,000 | -0.4% | -0.6% | -1.3% | -4.9% |
| Average Weekly Hours | 33.8 | 33.8 | 33.7 (Mar '05) | 33.8 | 33.7 | 33.7 |
| Average Hourly Earnings | 0.2% | 0.4% | 3.4% | 2.8% | 2.1% | 2.7% |
| Unemployment Rate | 4.7% | 4.8% | 5.1% (Mar '05) | 5.1% | 5.5% | 6.0% |

Tom Moeller
AuthorMore in Author Profile »Prior to joining Haver Analytics in 2000, Mr. Moeller worked as the Economist at Chancellor Capital Management from 1985 to 1999. There, he developed comprehensive economic forecasts and interpreted economic data for equity and fixed income portfolio managers. Also at Chancellor, Mr. Moeller worked as an equity analyst and was responsible for researching and rating companies in the economically sensitive automobile and housing industries for investment in Chancellor’s equity portfolio. Prior to joining Chancellor, Mr. Moeller was an Economist at Citibank from 1979 to 1984. He also analyzed pricing behavior in the metals industry for the Council on Wage and Price Stability in Washington, D.C. In 1999, Mr. Moeller received the award for most accurate forecast from the Forecasters' Club of New York. From 1990 to 1992 he was President of the New York Association for Business Economists. Mr. Moeller earned an M.B.A. in Finance from Fordham University, where he graduated in 1987. He holds a Bachelor of Arts in Economics from George Washington University.
More Economy in Brief


