 Global| Aug 05 2005
U.S. Payrolls Improve
by:Tom Moeller
|in:Economy in Brief
Summary
In July, non-farm payrolls outpaced Consensus expectations for a 180,000 rise and increased 207,000 while the June and the May increases were revised up to 166,000 and 126,000, respectively. While showing improvement, these monthly [...]
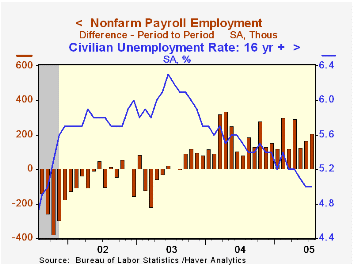
In July, non-farm payrolls outpaced Consensus expectations for a 180,000 rise and increased 207,000 while the June and the May increases were revised up to 166,000 and 126,000, respectively.
While showing improvement, these monthly increases which average 166,000 are down from the first four months of 2005 when payrolls rose an average 210,000.
Factory sector payrolls continued to decline in July, down 4,000, and the rate of decline has been steady. During the last three months factory payrolls fell an average 8,000 per month versus a 9,000 average during the first four months of 2005. Recent declines in motor vehicle industry payrolls mask some improvement in hiring elsewhere. Auto industry payrolls fell a sharp 10,700 in July following a steep 16,800 June drop but jobs in the machinery (+1.4% YTD) and in the computer & electronics industries (+0.9% YTD) have been rising. The diffusion index measuring one month change in factory payrolls rose to 53.6, the first month above 50 in one year.
Private service producing industries payrolls advanced 177,000 (1.3% YTD) last month following an upwardly revised 166,000 June gain. Professional & business services jobs gained 33,000 (1.6% YTD), education & health services rose 21,000 (1.2% YTD) and financial jobs rose 21,000 (1.2% YTD).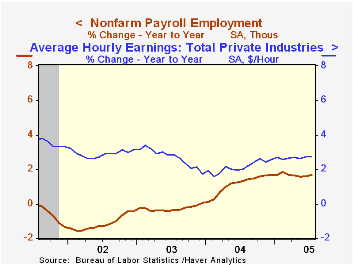
Construction jobs increased 7,000 (2.1% YTD) and total government employment rose 26,000 (0.4% YTD).
The unemployment rate from the household survey remained at a low 5.0% reflecting a 438,000 (1.4% YTD) rise in employment and a 450,000 (0.9% YTD) rise in the labor force. The labor force participation rate ticked up to 66.1% as the number of dropouts from the force reversed most of the increase in June.
The index of aggregate hours worked (employment times hours worked) rose 0.2% (1.5% YTD) and began the third quarter 0.3% above the second. Hours worked in 2Q increased 2.8% (AR) from 1Q05.
Average hourly earnings rose a firm 0.4% following two months of 0.2% increase.
Age and Education Effects on the Unemployment Rate from the Federal Reserve Bank of San Francisco is available here.
Payroll Employment Data: Measuring the Effects of Annual Benchmark Revisions from the Federal Reserve Bank of Atlanta can be found here.
| Employment | July | June | Y/Y | 2004 | 2003 | 2002 |
|---|---|---|---|---|---|---|
| Payroll Employment | 207,000 | 166,000 | 1.7% | 1.1% | -0.3% | -1.1% |
| Manufacturing | -4,000 | -21,000 | -0.5% | -1.2% | -4.9% | -7.2% |
| Average Weekly Hours | 33.7 | 33.7 | 33.7 | 33.7 | 33.7 | 33.8 |
| Average Hourly Earnings | 0.4% | 0.2% | 2.7% | 2.1% | 2.7% | 2.9% |
| Unemployment Rate | 5.0% | 5.0% | 5.5% | 5.5% | 6.0% | 5.8% |

Tom Moeller
AuthorMore in Author Profile »Prior to joining Haver Analytics in 2000, Mr. Moeller worked as the Economist at Chancellor Capital Management from 1985 to 1999. There, he developed comprehensive economic forecasts and interpreted economic data for equity and fixed income portfolio managers. Also at Chancellor, Mr. Moeller worked as an equity analyst and was responsible for researching and rating companies in the economically sensitive automobile and housing industries for investment in Chancellor’s equity portfolio. Prior to joining Chancellor, Mr. Moeller was an Economist at Citibank from 1979 to 1984. He also analyzed pricing behavior in the metals industry for the Council on Wage and Price Stability in Washington, D.C. In 1999, Mr. Moeller received the award for most accurate forecast from the Forecasters' Club of New York. From 1990 to 1992 he was President of the New York Association for Business Economists. Mr. Moeller earned an M.B.A. in Finance from Fordham University, where he graduated in 1987. He holds a Bachelor of Arts in Economics from George Washington University.
More Economy in Brief


