 Global| May 06 2005
U.S. Payrolls Firm
by:Tom Moeller
|in:Economy in Brief
Summary
April non-farm payrolls rose 274,000 following an upwardly revised 146,000 increase a month earlier. Consensus expectations had been for a 175,000 rise. The latest increase pulled the average three month change in payrolls (240,000) [...]
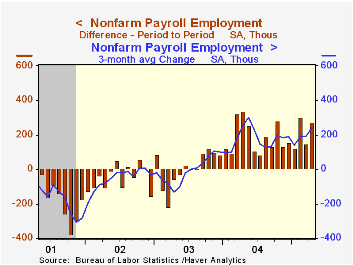
April non-farm payrolls rose 274,000 following an upwardly revised 146,000 increase a month earlier. Consensus expectations had been for a 175,000 rise. The latest increase pulled the average three month change in payrolls (240,000) to its highest in nearly a year.
The household survey also indicated that the labor market remained firm as the unemployment rate held at a low 5.2%. Employment rose 598,000 (1.8% y/y) and the labor force rose 605,000 (1.3% y/y) as the participation rate rose to 66.0%, its highest this year. The number of job losers fell sharply for the fourth straight month (-15.0% y/y) due to a 21.1% decline in the number of permanent job losers versus last year.
Private service producing payrolls rose 211,000 (2.0% y/y) last month and gains were spread across industries. Total government employment rose 18,000 (0.7% y/y) but federal government jobs fell again (-1.1% y/y). Factory sector payrolls fell 6,000 for the third monthly decline this year though the breadth of hiring gain improved slightly to 50%. Six-month breadth remained low at 38.7%.
Construction jobs rose a firm 47,000 (4.3% y/y).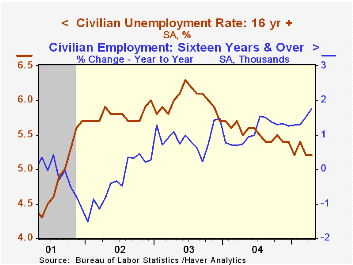
The index of aggregate hours worked (employment times hours worked) rose 0.9% (3.1% y/y) helped higher by a jump in the length of the workweek to its highest since 2002. The level of hours worked began the quarter 4.4% (AR) ahead of 1Q05.
Average hourly earnings increased 0.3% for the second month and earnings in manufacturing recovered all of the prior month's 0.2% decline (2.3% y/y).
Evidence of Wage Inequality, Worker Education, and Technology from the Federal Reserve Bank of St. Louis is available here.
A corrected FOMC Statement is available here.
| Employment | April | March | Y/Y | 2004 | 2003 | 2002 |
|---|---|---|---|---|---|---|
| Payroll Employment | 274,000 | 146,000 | 1.7% | 1.1% | -0.3% | -1.1% |
| Manufacturing | -6,000 | -7,000 | -0.1% | -1.2% | -4.9% | -7.2% |
| Average Weekly Hours | 33.9 | 33.7 | 33.7 | 33.7 | 33.7 | 33.8 |
| Average Hourly Earnings | 0.3% | 0.3% | 2.7% | 2.1% | 2.7% | 2.9% |
| Unemployment Rate | 5.2% | 5.2% | 5.5% | 5.5% | 6.0% | 5.8% |

Tom Moeller
AuthorMore in Author Profile »Prior to joining Haver Analytics in 2000, Mr. Moeller worked as the Economist at Chancellor Capital Management from 1985 to 1999. There, he developed comprehensive economic forecasts and interpreted economic data for equity and fixed income portfolio managers. Also at Chancellor, Mr. Moeller worked as an equity analyst and was responsible for researching and rating companies in the economically sensitive automobile and housing industries for investment in Chancellor’s equity portfolio. Prior to joining Chancellor, Mr. Moeller was an Economist at Citibank from 1979 to 1984. He also analyzed pricing behavior in the metals industry for the Council on Wage and Price Stability in Washington, D.C. In 1999, Mr. Moeller received the award for most accurate forecast from the Forecasters' Club of New York. From 1990 to 1992 he was President of the New York Association for Business Economists. Mr. Moeller earned an M.B.A. in Finance from Fordham University, where he graduated in 1987. He holds a Bachelor of Arts in Economics from George Washington University.
More Economy in Brief


