 Global| May 06 2005
U.S. Payrolls Firm
by:Tom Moeller
|in:Economy in Brief
Summary
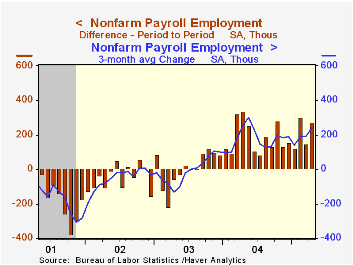
April non-farm payrolls rose 274,000 following an upwardly revised 146,000 increase a month earlier. Consensus expectations had been for a 175,000 rise. The latest increase pulled the average three month change in payrolls (240,000) [...]

April non-farm payrolls rose 274,000 following an upwardly revised 146,000 increase a month earlier. Consensus expectations had been for a 175,000 rise. The latest increase pulled the average three month change in payrolls (240,000) to its highest in nearly a year.
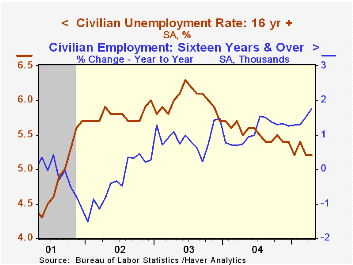
The household survey also indicated that the labor market remained firm as the unemployment rate held at a low 5.2%. Employment rose 598,000 (1.8% y/y) and the labor force rose 605,000 (1.3% y/y) as the participation rate rose to 66.0%, its highest this year. The number of job losers fell sharply for the fourth straight month (-15.0% y/y) due to a 21.1% decline in the number of permanent job losers versus last year.
Private service producing payrolls rose 211,000 (2.0% y/y) last month and gains were spread across industries. Total government employment rose 18,000 (0.7% y/y) but federal government jobs fell again (-1.1% y/y). Factory sector payrolls fell 6,000 for the third monthly decline this year though the breadth of hiring gain improved slightly to 50%. Six-month breadth remained low at 38.7%.
Construction jobs rose a firm 47,000 (4.3% y/y).
The index of aggregate hours worked (employment times hours worked) rose 0.9% (3.1% y/y) helped higher by a jump in the length of the workweek to its highest since 2002. The level of hours worked began the quarter 4.4% (AR) ahead of 1Q05.
Average hourly earnings increased 0.3% for the second month and earnings in manufacturing recovered all of the prior month's 0.2% decline (2.3% y/y).
Evidence of Wage Inequality, Worker Education, and Technology from the Federal Reserve Bank of St. Louis is available here.
A corrected FOMC Statement is available here.
| Employment | April | March | Y/Y | 2004 | 2003 | 2002 |
|---|---|---|---|---|---|---|
| Payroll Employment | 274,000 | 146,000 | 1.7% | 1.1% | -0.3% | -1.1% |
| Manufacturing | -6,000 | -7,000 | -0.1% | -1.2% | -4.9% | -7.2% |
| Average Weekly Hours | 33.9 | 33.7 | 33.7 | 33.7 | 33.7 | 33.8 |
| Average Hourly Earnings | 0.3% | 0.3% | 2.7% | 2.1% | 2.7% | 2.9% |
| Unemployment Rate | 5.2% | 5.2% | 5.5% | 5.5% | 6.0% | 5.8% |
by Carol Stone May 6, 2005

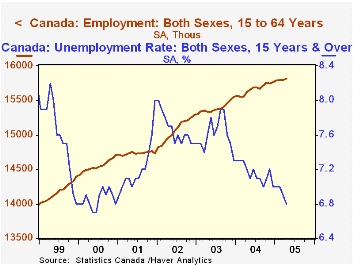
The Canadian economy also experienced job growth in April, with a total employment gain of 29,300, following a slim 4,400 rise in March. The great part of the April move was in service industries, as the number of workers in the goods sector held just about steady. From a year ago, employment increased 1.4%, indicating some slowing after a 2% average annualized rate of increase over the past three years.
In the goods sectors, April's flat result was the net of a nearly offsetting rise in construction jobs and fall in manufacturing. These same two have maintained this kind of pattern over the last year as well. In service industries, firm uptrends are evident in trade, finance, professional services and education. Transportation, health care and accommodations and food service are losing jobs, although the declines in the latter two are quite modest. 
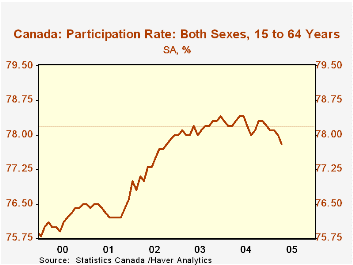
The unemployment rate in Canada has continued its declining trend begun in late 2003. The 6.8% in April is the lowest since the same level in December 2000. While this might suggest recent strength in the Canadian labor market, optimism must be tempered by the fact that employment growth has been slower. In fact, the inroads on the reported unemployment rate come from lower labor force participation. While employers are adding new jobs at a slower pace, people are pulling back somewhat from wanting jobs in the first place. This is reflected in the reduction in the participation rate by 0.4% from its 2004 average of 78.2% of the working-age population to 77.8% in April. Had participation remained at that level, calculations indicate that the labor force would have been nearly 80,000 larger in April and the resulting unemployment rate would not have declined.
| Canada | Mo/Mo Change, 000sYr/Yr % Apr 2005 | December/December|||||
|---|---|---|---|---|---|---|
| Apr 2005 | Mar 2005 | 2004 | 2003 | 2002 | ||
| Employment* | 29.3 | 4.4 | 1.4% | 1.5% | 1.9% | 4.0% |
| Goods - Producing* | 0.4 | 10.8 | 0.7% | 2.0% | -0.5% | 6.3% |
| Service - Producing* | 28.9 | -6.3 | 1.5% | 1.2% | 2.6% | 3.1% |
| Labor Force** | -5.6 | -8.2 | 0.7% | 1.1% | 1.6% | 3.2% |
| Unemployment Rate** | 6.8% | 7.0% | Apr 2004 | Annual Average | ||
| 7.3% | 7.2% | 7.7% | 7.7% | |||
| Participation Rate** | 77.8% | 78.0% | 78.3% | 78.2% | 78.1% | 77.4% |
Tom Moeller
AuthorMore in Author Profile »Prior to joining Haver Analytics in 2000, Mr. Moeller worked as the Economist at Chancellor Capital Management from 1985 to 1999. There, he developed comprehensive economic forecasts and interpreted economic data for equity and fixed income portfolio managers. Also at Chancellor, Mr. Moeller worked as an equity analyst and was responsible for researching and rating companies in the economically sensitive automobile and housing industries for investment in Chancellor’s equity portfolio. Prior to joining Chancellor, Mr. Moeller was an Economist at Citibank from 1979 to 1984. He also analyzed pricing behavior in the metals industry for the Council on Wage and Price Stability in Washington, D.C. In 1999, Mr. Moeller received the award for most accurate forecast from the Forecasters' Club of New York. From 1990 to 1992 he was President of the New York Association for Business Economists. Mr. Moeller earned an M.B.A. in Finance from Fordham University, where he graduated in 1987. He holds a Bachelor of Arts in Economics from George Washington University.
More Economy in Brief
 Global| Feb 05 2026
Charts of the Week: Balanced Policy, Resilient Data and AI Narratives
by:Andrew Cates


