 Global| Aug 01 2008
U.S. Payrolls Down, Jobless Rate Up
by:Tom Moeller
|in:Economy in Brief
Summary
Nonfarm payrolls fell 51,000 last month after a revised decline of 51,000 during June, according to the Bureau of Labor Statistics. The latest decline was less than expectations for a 75,000 drop but payrolls have declined in each [...]
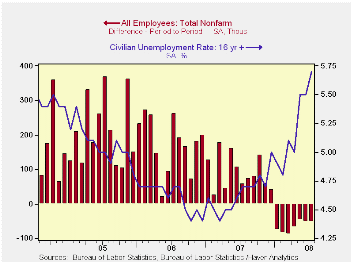
Nonfarm payrolls fell 51,000 last month after a revised decline of 51,000 during June, according to the Bureau of Labor Statistics. The latest decline was less than expectations for a 75,000 drop but payrolls have declined in each month of this year. The total drop so far in 2008 amounts to 463,000 jobs and during the last three months payrolls fell at a 0.4% annual rate. That compared to a rate of decline in excess of 2.0% by the end of the last recession.
Weakness in the latest jobs report reflects the effect of recent floods in the Midwest region of the country.
Factory sector jobs fell 35,000, the same as during June, and
at a 2.7% rate over the last three months. That was improved from the
fastest rate of decline (-4.2%) this cycle and it was slower than
during the 2001 recession employment when jobs dropped at a 10% rate.
Construction sector employment dropped 22,000 last month, half the June decline, and at a 5.9% rate during the last three months.
Hiring in the service sector fell 5,000 and rose at a rate of just 0.1% in the last three months. That negligible rate of increase has been stable since March and compares to a 1.6% rise last year.
Government sector jobs continued to rise, last month by 25,000, after firmer gains in May and June. They've increased at a 2.2% rate during the last three months. Federal government hiring rose at a 0.7% rate during the last three months while state as well as local government hiring rose at a 2.2% and a 2.4% rate, respectively.
Private service sector jobs continued to weaken as indicated by a 76,000 decline last month which followed a 94,000 June drop. It was the eighth consecutive monthly decline and the three-month rate of job loss was -0.9% during that period. Retail sector job loss continued at a 1.2% rate during the last three months, though that was eased from the 3.0% rate this past April. Motor vehicle & parts dealers jobs fell at a 4.7% rate. Jobs in the information sector fell 13,000 last month and at a 3.2% rate during the last three. Professional & business services sector have fallen at a 2.5%.
These declines have been offset by 7.5% three-month growth in
the number of jobs in education and by 2.6% growth health care jobs.
The number of finance sector jobs were unchanged last month but they're
down at a 0.8% rate during the last three. Temporary help services
jobs, often a leading indicator of employment growth, fell 29,000 last
month and at a 14.8% rate during the last three. Real estate sector
jobs have been falling at a 0.7% annual rate during the last three
months which is an improvement from the 3% to 4% rates of job loss late
last year and early this year.
The one month diffusion index, which measures the breadth of job gain or loss (50 is the break-even level), dropped to a new low for this cycle and stood at 41.2%. The three- month index also reached a new low of 40.0%. The three-month figure for the factory sector was weaker at 32.1%.
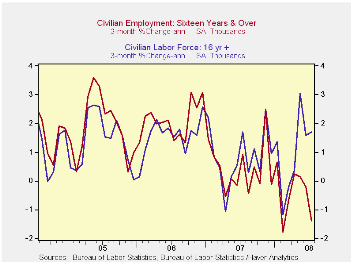
The Bureau of Labor Statistics household sector survey indicated that the unemployment rate rose to 5.7% in July versus expectations for a 5.6% rate. That was the highest level since January of 2004 as employment fell another 72,000 (-0.2% y/y) after the 155,000 June decline. The level of the unemployed rose 285,000 (23.1% y/y) after a 12,000 rise during June.
The labor force reversed the June decline and rose 213,000
(0.9% y/y) last month. The labor force participation rate was stable
m/m at 66.1%, 66.0% during all of last year and 66.2% in 2006. The
participation rate amongst adult men was 75.9%, the same as averaged
last year, and amongst adult women it was 60.8% versus 60.6% averaged
during 2007.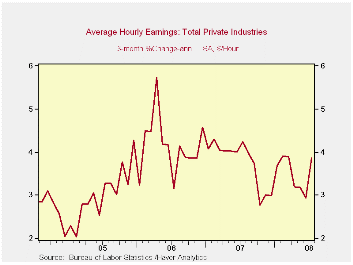
The average duration of unemployment slipped m/m to 17.1 weeks but that was still up from 16.9% weeks averaged during the last two years.
Average hourly earnings increased 0.3%, the same as during the prior two months, but three-month growth rose slightly to 3.9% after 4.0% growth during 2006 and 2007. Factory sector earnings rose 1.8% during the last three months, the weakest rate of gain since last summer, while private service sector earnings rose at a 0.5% rate.
| Employment: 000s | July | June | May | Y/Y | 2007 | 2006 | 2005 |
|---|---|---|---|---|---|---|---|
| Payroll Employment | -51 | -51 | -47 | -0.0% | 1.1% | 1.8% | 1.7% |
| Previous | -- | -62 | -62 | -- | 1.3% | 1.9% | 1.7% |
| Manufacturing | -35 | -35 | -21 | -2.8% | -1.9% | -0.5% | -0.6% |
| Construction | -22 | -49 | -38 | -6.0% | -1.0% | 4.9% | 5.2% |
| Average Weekly Hours | 33.6 | 33.7 | 33.7 | 33.8 (July '07) | 33.8 | 33.9 | 33.8 |
| Average Hourly Earnings | 0.3% | 0.3% | 0.3% | 3.4% | 4.0% | 3.9% | 2.7% |
| Unemployment Rate | 5.7% | 5.5% | 5.5% | 4.7% (July '07) | 4.6% | 4.6% | 5.1% |
by Tom Moeller August 1, 2008
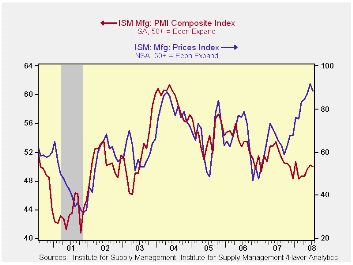
The Institute for Supply Management 's Composite Index of Manufacturing Sector Activity fell very slightly month-to-month during July to a break-even 50 from 50.2 in June. Still, the index is up from the monthly lows near 48 this past winter. Consensus expectations had been for more of a decline to 49.1 in July.
Despite the very recent improvement, the index's average level so far this year of 49.4 was its lowest since early-2003.
During the last twenty years there has been a 64% correlation between the level of the Composite Index and the three-month growth in factory sector industrial production.
It is appropriate to correlate the ISM index level with factory sector growth because the ISM index is a diffusion index. It measures growth by using all of the positive changes in activity added to one half of the zero change in activity measures.
The employment index improved markedly last month to a level
of 51.9. That was the first reading above the break-even level of 50
since October. During the last twenty years there has been a 67%
correlation between the level of the ISM employment index and the
three-month growth in factory sector employment.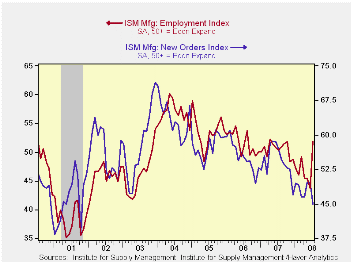
The new orders index, however, offset that rise with a decline to 45.0 which was its lowest level since the recession of 2001. The new export orders sub-series declined sharply to 54.0 which was its lowest reading since last December. During the last ten years there has been a 53% correlation between the index and the q/q change in real exports of goods in the GDP accounts.
The production index rose modestly to 52.9 but the inventories series fell sharply to 45.0.
Prices paid backed off a bit to a still high index level of 88.5. During the last twenty years there has been a 79% correlation between the price index and the three-month change in the PPI for intermediate goods.
| ISM Mfg | July | June | July '07 | 2007 | 2006 | 2005 |
|---|---|---|---|---|---|---|
| Composite Index | 50.0 | 50.2 | 52.3 | 51.1 | 53.1 | 54.4 |
| New Orders Index | 45.0 | 49.6 | 56.9 | 54.3 | 55.4 | 57.4 |
| Employment Index | 51.9 | 43.7 | 50.3 | 50.5 | 51.7 | 53.6 |
| Prices Paid Index (NSA) | 88.5 | 91.5 | 65.0 | 64.6 | 65.0 | 66.4 |
by Tom Moeller August 1, 2008
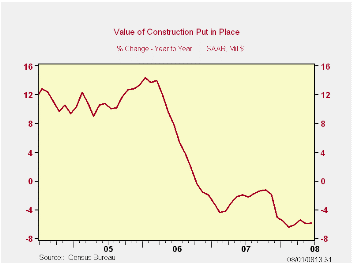
The value of construction put in place fell 0.4% during June after having been unchanged in May. The decline was as-expected.Year-to-year construction was down 5.9% but the level of activity so far this year has been roughly stable.
Residential building activity, however, continued to decline in June by 1.8%. Since it's peak it has fallen by more than one-third. Single-family construction continued quite weak as it fell another 3.7% (-39.1% y/y). Building activity on multi-family units edged down 0.4% (-8.0% y/y). Spending on improvements has been edging higher since last November but it's still off 2.0% y/y.
During the last twenty years there has been an 84% correlation between the q/q change in the value of residential building and its contribution to growth in real GDP.
The value of nonresidential building activity rose another
0.8% led by a 1.2% (37.9% y/y) jump in lodging spending. Spending on
health care facilities rose 0.6% (10.0% y/y) but office construction
was roughly unchanged (12.8% y/y).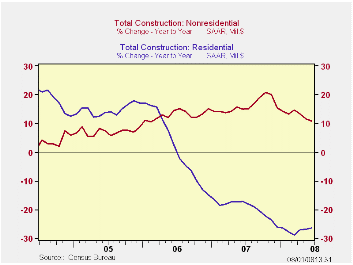
Public construction fell a slight 0.2%. The y/y gain of 5.2% is down from 12.3% growth last year. Nevertheless, spending on office structures continued quite firm at 26.5% y/y. The value of construction spending on highways & streets was roughly unchanged y/y. (The value of construction on highways & streets is roughly one third of the value of total public construction spending.) Building activity of educational facilities fell 1.5% (+4.2% y/y) during June.
The more detailed categories of construction represent the Census Bureau’s reclassification of construction activity into end-use groups. Finer detail is available for many of the categories; for instance, commercial construction is shown for automotive sales and parking facilities, drugstores, building supply stores, and both commercial warehouses and mini-storage facilities. Note that start dates vary for some seasonally adjusted line items in 2000 and 2002 and that constant-dollar data are no longer computed.
Are Inflation Targets Good Inflation Forecasts? from the Federal Reserve Bank of Chicago is available here.
| Construction (%) | June | May | Y/Y | 2007 | 2006 | 2005 |
|---|---|---|---|---|---|---|
| Total | -0.4 | 0.0 | -5.9 | -2.7 | 6.3 | 11.2 |
| Private | -0.4 | 0.0 | -9.6 | -6.9 | 5.5 | 12.7 |
| Residential | -1.8 | -1.1 | -26.7 | -19.8 | 1.0 | 14.9 |
| Nonresidential | 0.8 | 1.1 | 15.0 | 19.6 | 16.2 | 7.8 |
| Public | -0.2 | 0.1 | 5.2 | 12.3 | 9.3 | 6.2 |
by Robert Brusca August 1, 2008
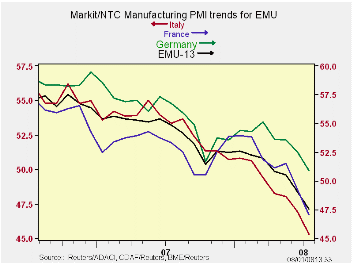
The Markit/NTC PMIs show a clear pattern of weakness in the manufacturing sector. Among the major PMI reporters only Germany and Greece still post PMI values above 50, the ostensible neutral mark. If we calculate where the various PMIs stand in their respective historic ranges we find that only Germany is above its range midpoint. Spain, Ireland and the UK are on all time lows since this measure has been reported going back to March 2000. We use March 2000 since it is the date from which all the above PMIs are available although some individual country reports go back farther. We want to compare them over a common time horizon.
On this basis most of the PMIs for manufacturing are in the lower third of their range or weaker. The EMU measure has slid to the lower third of its range. Europe’s manufacturing sector continues to erode.
| Markit/NTC Manufacturing Indexes | ||||||||
|---|---|---|---|---|---|---|---|---|
| Jul-08 | Jun-08 | May-08 | 3Mo | 6Mo | 12Mo | Percentile | ||
| Euro-13 | 47.38 | 49.16 | 50.60 | 49.05 | 50.38 | 51.62 | 27.0% | |
| Germany | 50.90 | 52.56 | 53.57 | 52.34 | 53.35 | 53.69 | 50.8% | |
| France | 47.05 | 49.24 | 51.48 | 49.26 | 50.76 | 51.54 | 22.6% | |
| Italy | 45.32 | 46.91 | 48.05 | 46.76 | 48.10 | 49.90 | 13.9% | |
| Spain | 39.20 | 40.61 | 43.79 | 41.20 | 43.66 | 47.04 | 0.0% | |
| Austria | 46.97 | 48.39 | 49.76 | 48.37 | 50.12 | 52.14 | 23.5% | |
| Greece | 51.63 | 53.81 | 53.77 | 53.07 | 53.11 | 53.31 | 42.3% | |
| Ireland | 43.39 | 44.71 | 45.21 | 44.44 | 45.63 | 48.58 | 0.0% | |
| Netherlands | 47.99 | 51.07 | 51.46 | 50.17 | 51.17 | 53.14 | 31.8% | |
| EU | ||||||||
| UK | 44.26 | 45.92 | 49.23 | 46.47 | 48.54 | 51.06 | 0.0% | |
by Robert Brusca August 1, 2008
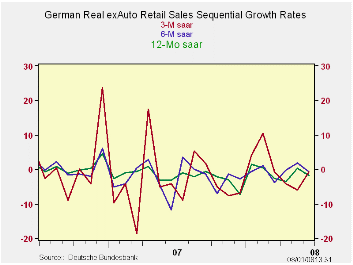
Add German retail sales trends to the list of items turning out more negative prospects for the e-Zone. Retail sales ex-autos as well as real retail sales ex autos saw sales drop by 1.4% month-to-month in June of 2008. Over three-months and six-months and 12-months retail ex-auto retail sales are declining.
In the current quarter real retail sales excluding autos are falling at a sharp 3.8% annual rate.
All the major components of retail sales are showing declines in 2008-Q2 compared to Q1. The industrial data are slowing and now the consumer side data are slowing as well. There does not appear to be a part of the economy prepared to step up and make up for the weakness elsewhere. Europe is slipping. Germany is leading the way.
| German Real and Nominal Retail Sales | ||||||||
|---|---|---|---|---|---|---|---|---|
| Nominal | Jun-08 | May-08 | Apr-08 | 3-MO | 6-MO | 12-MO | YrAgo | Qtr Saar |
| Retaill Ex auto | -1.4% | 0.9% | 0.8% | 0.8% | 2.3% | 1.0% | -2.8% | -1.6% |
| Food Bev & Tobacco | 1.0% | -1.8% | -0.3% | -4.0% | 6.9% | 1.2% | -3.4% | -3.2% |
| Clothing footwear | -9.6% | 14.3% | -0.3% | 12.8% | 0.2% | -1.4% | -0.5% | -0.2% |
| Real | ||||||||
| Retail Ex auto | -1.4% | 0.5% | 0.7% | -0.8% | -0.8% | -1.8% | -3.1% | -3.8% |

Tom Moeller
AuthorMore in Author Profile »Prior to joining Haver Analytics in 2000, Mr. Moeller worked as the Economist at Chancellor Capital Management from 1985 to 1999. There, he developed comprehensive economic forecasts and interpreted economic data for equity and fixed income portfolio managers. Also at Chancellor, Mr. Moeller worked as an equity analyst and was responsible for researching and rating companies in the economically sensitive automobile and housing industries for investment in Chancellor’s equity portfolio. Prior to joining Chancellor, Mr. Moeller was an Economist at Citibank from 1979 to 1984. He also analyzed pricing behavior in the metals industry for the Council on Wage and Price Stability in Washington, D.C. In 1999, Mr. Moeller received the award for most accurate forecast from the Forecasters' Club of New York. From 1990 to 1992 he was President of the New York Association for Business Economists. Mr. Moeller earned an M.B.A. in Finance from Fordham University, where he graduated in 1987. He holds a Bachelor of Arts in Economics from George Washington University.
More Economy in Brief


