 Global| Apr 04 2008
U.S. Payrolls Down For Third Month, Unemployment Up
by:Tom Moeller
|in:Economy in Brief
Summary
For the third consecutive month the Bureau of Labor Statistic reported that nonfarm payrolls fell. The 80,000 worker decline in March was the largest of the three and the two prior months' declines were revised deeper from the initial [...]
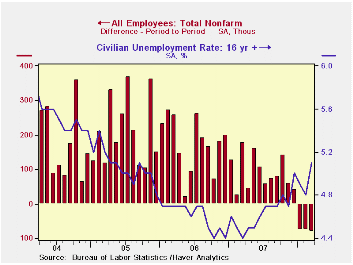
For the third consecutive month the Bureau of Labor Statistic reported that nonfarm payrolls fell. The 80,000 worker decline in March was the largest of the three and the two prior months' declines were revised deeper from the initial reports. Expectations had been for a 53,000 worker decline in March payrolls.
Has economic recession begun? When the job figures are combined with a roughly stable level of hours worked, the level of aggregate hours (employment times hours) fell in two of the last three months and fell at an annual rate of 1.2% during 1Q. Over the last thirty years there has been a 76% correlation between the q/q change in aggregate hours worked and the change in real GDP. The 25% that is left out of that correlation reflects productivity growth and during the last three years it rose between 1.0% and 2.0%. When aggregate hours and productivity are added they suggest no growth or even a slight decline in 1Q real GDP.
From the household sector survey the unemployment
rate rose to 5.1%, its highest level since May of 2005. Job
creation did not keep up with growth in the labor force. Household
employment declined by 24,000 (-0.1% y/y) and jobs declined irregularly
in each month since early last year. The labor force, conversely, rose
410,000 last month. The annual rate of gain fell to 0.6% from 1.9%
early last year. Individuals who stopped looking for work did so at a
1.4% y/y rate in March, up from a zero rate of change at the end of
2006.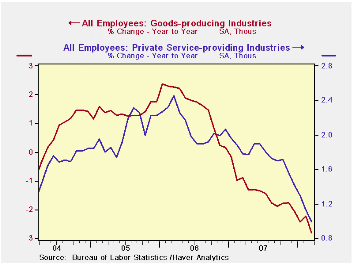
From the establishment survey, aside from continued growth in government sector jobs (+1.1% y/y), the figures for private nonfarm payrolls painted a distressing picture of the job market. Private sector payrolls fell 98,000 in March. It was the fourth consecutive monthly decline and it followed a 109,000 drop in February. While the y/y change in private payrolls still was a positive 0.3%, recent momentum as indicated by the three month change, fell to a negative 1.0% (AR).
Factory sector job loss intensified last month to a 48,000 decline, nearly the largest monthly drop since 2003. The three month rate of job loss deepened to -3.7%, also its fastest since 2003.
Construction sector employment declines continued to
accelerate. The m/m decline of 51,000 was the largest in nearly a year
and the three month growth rate stood at -6.6%, near its lowest since
late 1991.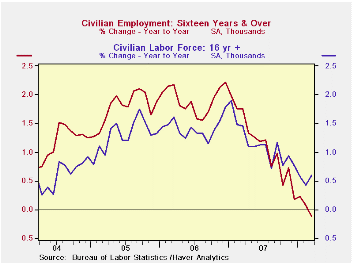
Hiring in the private service sector was more distressing given its norm of positive job growth. Jobs in retail trade fell for the sixth month in the last seven and the three month rate of change deepened to -1.9%. Professional & business services jobs fell for the third straight month and the three month rate of change was -2.1%. Temporary help services jobs again was quite weak and fell 21,600 pulling three month growth to -8.9% (AR). Jobs here have been declining for more than a year. Employment in finance dropped by 5,000 and they're down 1.5% from the late 2006 peak. Weakness in the real estate sector jobs fell 4,200 job last month and at a 3.6% rate over the last three months.
Just as during February, the March employment figures contained an indicator which portended even further weakness in overall job creation. The one month diffusion index, which measures the breadth of job gain or loss (50 is the break even level), indicated loss at 47.7%. The three month index was an even weaker 42.9% which was its lowest since 2003.
Average hourly earnings rose a very steady 0.3%. Factory sector earnings rose 0.2% (2.9% y/y) and private service-providing earnings rose 0.3% (4.1% y/y) for the second month.
The average duration of unemployment fell slightly to 16.2
weeks from 16.8 in February. Those figures are down from the averages
of the prior several years.
Central Bank Commitment and Communication is yesterday's speech by Fed GovernorFrederic S. Mishkin and it can be found here.
| Employment: 000s | March | February | January | Y/Y | 2007 | 2006 | 2005 |
|---|---|---|---|---|---|---|---|
| Payroll Employment | -80 | -76 | -76 | 0.4% | 1.1% | 1.8% | 1.7% |
| Previous | -- | -63 | -22 | -- | 1.3% | 1.9% | 1.7% |
| Manufacturing | -48 | -46 | -35 | -2.2% | -1.9% | -0.5% | -0.6% |
| Construction | -51 | -37 | -39 | -4.6% | -1.0% | 4.9% | 5.2% |
| Average Weekly Hours | 33.8 | 33.7 | 33.7 | 33.9 (Mar'07) | 33.8 | 33.9 | 33.8 |
| Average Hourly Earnings | 0.3% | 0.3% | 0.3% | 3.6% | 4.0% | 3.9% | 2.7% |
| Unemployment Rate | 5.1% | 4.8% | 4.9% | 4.4% (Mar'07) | 4.6% | 4.6% | 5.1% |

Tom Moeller
AuthorMore in Author Profile »Prior to joining Haver Analytics in 2000, Mr. Moeller worked as the Economist at Chancellor Capital Management from 1985 to 1999. There, he developed comprehensive economic forecasts and interpreted economic data for equity and fixed income portfolio managers. Also at Chancellor, Mr. Moeller worked as an equity analyst and was responsible for researching and rating companies in the economically sensitive automobile and housing industries for investment in Chancellor’s equity portfolio. Prior to joining Chancellor, Mr. Moeller was an Economist at Citibank from 1979 to 1984. He also analyzed pricing behavior in the metals industry for the Council on Wage and Price Stability in Washington, D.C. In 1999, Mr. Moeller received the award for most accurate forecast from the Forecasters' Club of New York. From 1990 to 1992 he was President of the New York Association for Business Economists. Mr. Moeller earned an M.B.A. in Finance from Fordham University, where he graduated in 1987. He holds a Bachelor of Arts in Economics from George Washington University.
More Economy in Brief


