 Global| Mar 07 2008
U.S. Payrolls Again Fell Unexpectedly
by:Tom Moeller
|in:Economy in Brief
Summary
The Bureau of Labor Statistics reported that for the second consecutive month, nonfarm payrolls fell. A 63,000 decline last month followed a downwardly revised 22,000 drop during January. The December job gain also was revised weaker. [...]
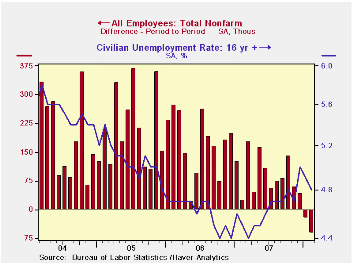
The Bureau of Labor Statistics reported that for the second consecutive month, nonfarm payrolls fell. A 63,000 decline last month followed a downwardly revised 22,000 drop during January. The December job gain also was revised weaker. Expectations had been for a modest 25,000 increase in February payrolls.
The decline in payrolls was the first consecutive two-month drop since 2003.
To the upside was job creation in the government sector where February employment rose 38,000 (1.1% y/y). Strength in hiring by state governments (1.2% y/y) and localities (1.3% y/y) has offset weakness in job creation by the Federal government (-0.1% y/y). This strength in government sector job creation only highlights weakness in the February labor report. Private sector employment fell 101,000 (+0.5% y/y), the largest decline of three during the last three months.
Weakness in factory sector hiring intensified as indicated by
a 52,000 drop in payrolls. That was the deepest since 2003 and compared
to an average monthly decline of 22,000 last year.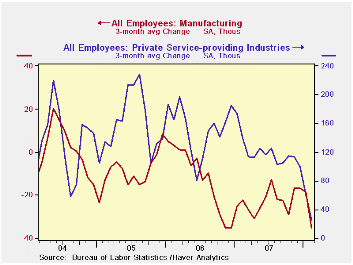
The rate of decline in construction employment also picked up steam. Employment here fell 39,000, twice the average monthly job loss last year.
The news out of the private service sector was perhaps more distressing. A 12,000 loss of jobs was the first since 2003. It dropped the two month change to a meager 8,000 and it compared to an average monthly gain of 109,000 last year. Professional & business services jobs fell by 20,000 (+1.3% y/y) while temporary help services jobs cratered 27,600 (-3.9% y/y). They have been declining for more than a year. Jobs in retail trade also fell a hard 34,100 (-0.0% y/y) and a January increase was revised away. Employment in finance dropped as well by 12,000 and it fell 1.5% from the late 2006 peak. Weakness in the real estate sector continued to lead the softening with a 7,000 job loss last month. Since the 2006 peak jobs are down 2.2%
Jobs in education continued to grow. A firm 30,000 February increase was only slightly off last year's pace of 45,000 per month (3.0% y/y) while job gains in the health care sector rose 37,000 (2.9% y/y), right on last year's pace. Jobs in the leisure & hospitality sector also rose a steady 21,000 (2.5% y/y) last month.
Continuing to portend further weakness in overall job creation was another decline in the one month diffusion index to 45.6%. This measure of the breadth of job creation amongst industries was its lowest level since 2003. The three month index also was a weak 46.9%.
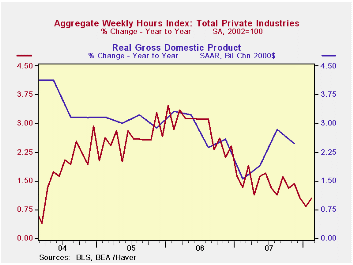
What the employment numbers say about overall economic growth
this quarter is not good. When the job figures are combined with what
was a stable level of hours worked, the level of aggregate hours
(employment times hours) fell both last month and in January. Those
declines pulled the average for 1Q so far down 1.3% (AR) from 4Q07.
During the last thirty years there has been a 76% correlation between
the q/q change in aggregate hours worked and the change in real GDP.
That correlation has fallen in recent years, however, as productivity
has picked up.
Average hourly earnings rose a very steady 0.3%. Weakness in job creation, however, has lowered the y/y gain to 3.7% which is down slightly from the peak 4.0% rise during all of last year. Factory sector earnings rose 0.1% (3.0% y/y) and private service-providing earnings rose 0.3% (3.8% y/y).
The unemployment rate slipped again, last
month to 4.8%. Household employment declined 255,000 (0.1% y/y) and
that points up the deterioration in y/y job growth to 0.1% from a 1.1%
gain during all of last year and of 1.9% in 2006. A decline in the
labor force of 450,000 (+0.4% y/y) is what kept the February
unemployment rate from rising.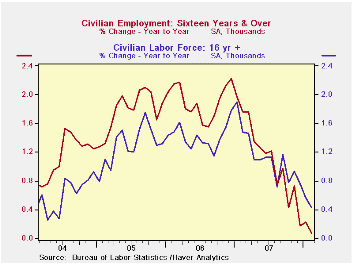
The average duration of unemployment fell slightly to 16.8
weeks from 17.5 in January and from 16.9 weeks last year.
Today's announcement that the Fed addressed
heightened liquidity pressures can be found here.
Exchange Rate Pass-Through and Monetary Policy is today's speech by Federal Reserve Board Governor Frederic S. Mishkin and it is available here.
| Employment: 000s | February | January | December | Y/Y | 2007 | 2006 | 2005 |
|---|---|---|---|---|---|---|---|
| Payroll Employment | -63 | -22 | 41 | 0.6% | 1.1% | 1.8% | 1.7% |
| Previous | -- | -17 | 82 | -- | 1.3% | 1.9% | 1.7% |
| Manufacturing | -52 | -31 | -22 | -2.1% | -1.9% | -0.5% | -0.6% |
| Construction | -39 | -25 | -55 | -2.9% | -1.0% | 4.9% | 5.2% |
| Average Weekly Hours | 33.7 | 33.7 | 33.8 | 33.7 (Feb. '07) | 33.8 | 33.9 | 33.8 |
| Average Hourly Earnings | 0.3% | 0.3% | 0.3% | 3.7% | 4.0% | 3.9% | 2.7% |
| Unemployment Rate | 4.8% | 4.9% | 5.0% | 4.5% (Feb '07) | 4.6% | 4.6% | 5.1% |
by Robert Brusca March 7, 2008
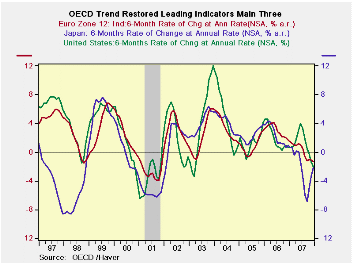
The OECD CLIs are largely still falling over the most recent three months, but generally the three-month drops are at a slower pace than the pace of the declines over six months. That is not the best news but it is good news of sorts. Of course the US is an exception to this observation since the three-month US decline is accelerating. Japan is the other sort of exception with an actual rise over three months and rise over six months. Japan had hit the skids in CLI terms ahead of the pack. In real time Japan’s economy is still slipping.
We can hope that Japan’s resurgent indicator implies that it has shrugged off a brush with recession. But the fact that key US economy is sinking faster than anyone else should give us pause about rosy scenarios. For the most part the OECD characterizes these results as consistent with a moderate slowdown. But with some of the recent weak data in the US, recent financial market turmoil that has reappeared, and the CLI trend there is clear downside risk.
| OECD Trend-restored leading Indicators | ||||
|---|---|---|---|---|
| Growth progression-SAAR | ||||
| 3Mos | 6Mos | 12mos | Yr-Ago | |
| OECD | -1.0% | -2.4% | -0.4% | 1.6% |
| OECD 7 | -3.3% | -4.2% | -1.4% | 0.6% |
| OECD.Europe | -0.9% | -2.0% | -0.8% | 2.0% |
| OECD.Japan | 8.9% | 0.5% | -1.8% | 1.0% |
| OECD US | -6.8% | -6.0% | -1.2% | 0.2% |
| Six month readings at 6-Mo Intervals: | ||||
| Recent six | 6Mo Ago | 12Mo Ago | 18MO Ago | |
| OECD | -2.4% | 1.7% | 2.1% | 1.2% |
| OECD 7 | -4.2% | 1.5% | 1.1% | 0.1% |
| OECD.Europe | -2.0% | 0.4% | 1.3% | 2.7% |
| OECD.Japan | 0.5% | -4.1% | 1.3% | 0.7% |
| OECD US | -6.0% | 3.8% | 1.5% | -1.1% |
| Slowdowns indicated by BOLD RED | ||||
by Robert Brusca March 7, 2008
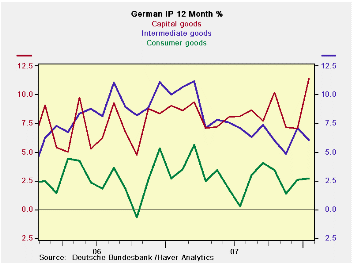
German IP was a breath of fresh air in January. But it may not have been made in the best of circumstances. Capital goods output surged by 6.2% m/m possibly a result of special rules favoring investment that are phasing out. Construction output skyrocketed by 11.7% m/m on what obviously was a beneficial weather effect that will not just go away but will unwind in the months ahead and suck growth out of IP. As a result, in the new quarter construction is advancing at 111% pace and capital goods output at a 40.2% annual rate - eye popping numbers. These are two special cases. Meanwhile, consumer goods output tailed in the month falling by 0.6% m/m. and intermediate goods output fell by 1% m/m. Still MFG IP rose by 1.9% in January and is up at a 19.6% pace in the new quarter. The IP numbers are in sharp contrast to the 1.5% drop in January orders and the 7.6% drop in orders in Q1.
So Germany has some cross-currents. Currently the strength is lodged in areas that look be temporary or related to expiring stimulus. The more important, lasting, force of consumer spending continues to lag. Germans looking for better times in 2008 were uniformly pinning hopes on the consumer. Consumer is now a clear laggard. The IP figure tells us the same thing other retail reports have been saying about the consumer. Moreover, the weakness in orders tell us that the surge in output is not likely to last.
| Total German IP Quarter | |||||||
|---|---|---|---|---|---|---|---|
| SAAR except m/m | Jan-08 | Dec-07 | Nov-07 | 3-mo | 6-mo | 12-mo | Quarter-to-Date |
| IP total | 1.8% | 1.5% | -0.3% | 13.2% | 10.1% | 7.0% | 18.0% |
| Consumer | -0.6% | 2.7% | -1.2% | 3.5% | 8.5% | 2.7% | 4.9% |
| Capital | 6.2% | -0.8% | 0.2% | 24.7% | 17.5% | 11.4% | 40.2% |
| Intermediate | -1.0% | 3.8% | -0.2% | 10.6% | 7.1% | 6.0% | 8.7% |
| Memo | |||||||
| Construction | 11.7% | 2.2% | -0.2% | 68.5% | 30.8% | 4.5% | 111.3% |
| MFG IP | 1.9% | 1.7% | -0.2% | 14.8% | 11.4% | 7.5% | 19.6% |
| MFG Orders | -1.5% | -1.1% | 3.0% | 1.2% | 9.3% | 9.6% | -7.6% |

Tom Moeller
AuthorMore in Author Profile »Prior to joining Haver Analytics in 2000, Mr. Moeller worked as the Economist at Chancellor Capital Management from 1985 to 1999. There, he developed comprehensive economic forecasts and interpreted economic data for equity and fixed income portfolio managers. Also at Chancellor, Mr. Moeller worked as an equity analyst and was responsible for researching and rating companies in the economically sensitive automobile and housing industries for investment in Chancellor’s equity portfolio. Prior to joining Chancellor, Mr. Moeller was an Economist at Citibank from 1979 to 1984. He also analyzed pricing behavior in the metals industry for the Council on Wage and Price Stability in Washington, D.C. In 1999, Mr. Moeller received the award for most accurate forecast from the Forecasters' Club of New York. From 1990 to 1992 he was President of the New York Association for Business Economists. Mr. Moeller earned an M.B.A. in Finance from Fordham University, where he graduated in 1987. He holds a Bachelor of Arts in Economics from George Washington University.
More Economy in Brief


