 Global| Nov 03 2006
U.S. Payroll Report: More Upward Revisions
by:Tom Moeller
|in:Economy in Brief
Summary
Nonfarm payrolls last month rose 92,000 and for the second month fell short of Consensus expectations which were for a 125,000 rise. However, again for the second month, upward revisions to prior months' increases left the impression [...]
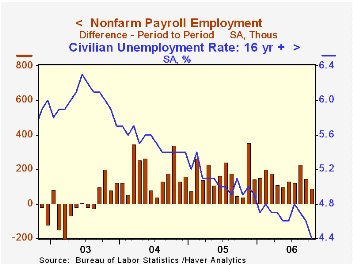
Nonfarm payrolls last month rose 92,000 and for the second month fell short of Consensus expectations which were for a 125,000 rise. However, again for the second month, upward revisions to prior months' increases left the impression of firmness in the labor market
For September, payrolls are now estimated to have risen 148,000, nearly triple the initial estimate. In addition, the August increase is now pegged at 230,000, up from 188,000 estimated last month. The gains pulled the three month average increase in jobs to 157,000 and the ten month average to 147,000, just below last year's average monthly gain of 165,000 and an average 175,000 during 2004.
Further evidence of a firm labor market was provided by the unemployment rate which declined to a five year low of 4.4%. The drop reflected an employment gain of 437,000 and not a typo. It was the largest monthly increase since early 2005 (1.9% y/y) and followed a 271,000 September gain. The labor force increased 199,000 (1.3% y/y) and the labor force participation rate held for the fifth month at 66.2%, up from the monthly lows during 2005 of 65.8%.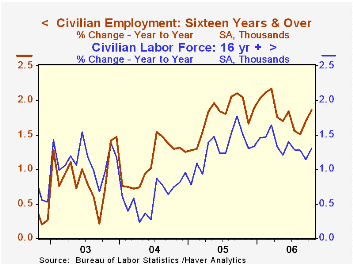
Government payrolls increased 34,000 (1.1% y/y). As a result private payrolls rose 58,000 (1.6% y/y) following upwardly revised gains of 120,000 and 180,000 in September and August, respectively.
The breadth of one month gain in private payrolls slipped a bit to 54.9% in October from an upwardly revised 55.9% in September but the three month diffusion index fell to 55.6%, the lowest level since early 2005. In the factory sector the one month breadth of gain fell further below break even to 40.5% from 43.5% in August. The three month diffusion index fell to 36.9%, also it's lowest in nearly a year.
Private service-producing jobs rose 118,000 (1.7% y/y) and a 126,000 September increase was double the initial estimate. Professional & business services employment rose 43,000 (2.8% y/y) while temporary help services jobs recovered 15,000 (1.1% y/y). Jobs in education & health rose 28,000 (2.5% y/y) while leisure & hospitality jobs increased 35,000 (2.5% y/y).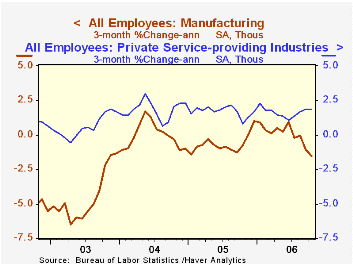
Factory sector payrolls fell a hard 39,000, the seventh m/m decline this year and the largest since 2003. Jobs in motor vehicle & parts industries fell 14,700 (-2.9% y/y) while jobs in furniture fell 3,300 (-3.5% y/y) and fabricated metals declined 3,700 (+2.0% y/y). Jobs in wood products also fell a sharp 5,000 (-2.4% y/y) and nondurables dropped 20,000 (-1.0% y/y) with textile industries down quite hard.
Construction employment fell 26,000 (+2.0% y/y) after a little revised 5,000 worker gain during September.
Average hourly earnings doubled the previous month's increase and rose 0.4%. Factory sector earnings rose 0.4% (1.3% y/y), the largest gain in a year.
The workweek rose to 33.9 hours, back to the highest level since 2002.
Are Two Employment Surveys Better than One? from the Federal Reserve Bank of St. Louis is available here
Money and Monetary Policy for the Twenty-First Century, also from the Federal Reserve Bank of St. Louis can be found here
| Employment | October | September | Y/Y | 2005 | 2004 | 2003 |
|---|---|---|---|---|---|---|
| Payroll Employment | 92,000 | 148,000 | 1.5% | 1.5% | 1.1% | -0.3% |
| Manufacturing | -39,000 | -12,000 | -0.1% | -0.6% | -1.3% | -4.9% |
| Average Weekly Hours | 33.9 | 33.8 | 33.8 (Oct. '05) | 33.8 | 33.7 | 33.7 |
| Average Hourly Earnings | 0.4% | 0.2% | 3.9% | 2.8% | 2.1% | 2.7% |
| Unemployment Rate | 4.4% | 4.6% | 5.1% (Sept. '05) | 5.1% | 5.5% | 6.0% |
by Tom Moeller November 3, 2006
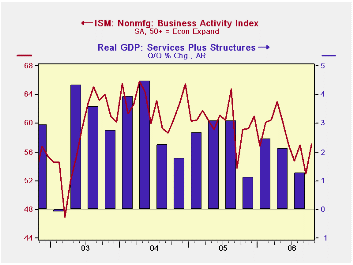
The Business Activity Index for the non-manufacturing sector in October recovered all of the prior month's decline and rose to 57.1. The figure from the Institute for Supply Management (ISM) exceeded Consensus expectations for a lesser rise to 54.5.
Since the series' inception in 1997 there has been a 50% correlation between the level of the Business Activity Index and the q/q change in real GDP for services plus construction.
The new orders sub-index slipped to 56.5 after a sharp September increase though the employment index gave back all of its September gain. At 51.0 it was at the lowest monthly level since 2004 and just 14% of survey respondents reported higher employment. Since the series' inception in 1997 there has been a 60% correlation between the level of the ISM non-manufacturing employment index and the m/m change in payroll employment in the service producing plus the construction industries.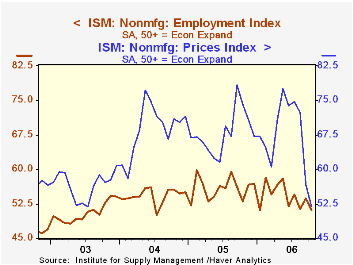
Pricing power dropped to its worst since 2003. Since inception eight years ago, there has been a 70% correlation between the price index and the y/y change in the GDP services chain price index.
ISM surveys more than 370 purchasing managers in more than 62 industries including construction, law firms, hospitals, government and retailers. The non-manufacturing survey dates back to July 1997.Business Activity Index for the non-manufacturing sector reflects a question separate from the subgroups mentioned above. In contrast, the NAPM manufacturing sector composite index is a weighted average five components.
| ISM Nonmanufacturing Survey | October | September | Oct. '05 | 2005 | 2004 | 2003 |
|---|---|---|---|---|---|---|
| Business Activity Index | 57.1 | 52.9 | 59.2 | 60.1 | 62.5 | 58.3 |
| Prices Index | 51.9 | 56.7 | 74.1 | 67.9 | 68.8 | 56.6 |
by Carol Stone November 3, 2006

Canadian labor markets seem to be staging a comeback after something of a sinking spell during the summer. In October data reported this morning by StatCan, employment gained by 50,500 and the unemployment rate fell to 6.2%, the lowest since 6.1% in May and June.
Back in September we were puzzled about whether recent months' job losses were a sign of sagging activity, or merely a correction after an outsized rise in May. After two months of increases, we probably can conclude that the latter is the more valid conclusion. In October, at 16,555,500, employment in Canada reached a new high.
Further, the downtrend we thought we were seeing in the goods-producing sector may also be "just a phase". September and October had gains of 18,000 and 9,000, respectively, in construction, mining and utilities. We'd attribute these increases to added supply efforts in Canada's energy production. It is still the case that manufacturing jobs are declining.
Service industries have mixed performances. Some, like finance, business support services and accommodation and food services, are growing vigorously. But others, including professional and technical activities and information services, are waffling after extended uptrends. The service sector as a whole is gaining, but the sources of growth seem to be different most every month.
The unemployment rate fell 0.2 point in October. Not all of that move represents good news, though. Along with the employment growth, the number of people in the labor force flattened out. The so-called participation rate, the labor force as a portion of the population over age 15, has edged lower, reaching 67.08%, the lowest since February's 67.02%; this rate peaked at 67.34% in July. These may look like small differences, but in Canada, each 0.1% in the participation rate represents about 26,000 people who are seeking work or deciding not to seek work. All these caveats aside, the decline in the unemployment rate obviously contains more good news than bad, and we are encouraged by the October labor data, which indeed seem to confirm that the declines in the summer were perhaps a "vacation" and labor markets have picked up once again.
These national Canadian data are contained in Haver's CANSIM database. Some detail is also available for the Provinces; those data are in CANSIMR.
| Canada (Seasonally Adjusted) |
Oct 2006 | Sept 2006 | Aug 2006 | Year Ago | 2005 | 2004 | 2003 |
|---|---|---|---|---|---|---|---|
| Employment (000s) | 16,555 | 16,505 | 16,488 | 16,268 | 16,169 | 15,949 | 15,672 |
| Change, 000s/% | +50 | +16 | -16 | 1.8% | 1.4% | 1.8% | 2.4% |
| Goods-Producing | +9 | +18 | -18 | -0.4% | 0.2% | 1.7% | 1.2% |
| Service-Producing | +2 | +2 | +30 | 2.8% | 2.1% | 1.8% | 2.7% |
| Unemployment (000s) | 1,086 | 1,131 | 1,141 | 1,155 | 1,173 | 1,235 | 1,286 |
| Unemployment Rate (%) | 6.2 | 6.4 | 6.5 | 6.6 | 6.8 | 7.2 | 7.6 |
| Participation Rate (%) | 67.08 | 67.14 | 67.21 | 67.20 | 67.20 | 67.54 | 67.54 |

Tom Moeller
AuthorMore in Author Profile »Prior to joining Haver Analytics in 2000, Mr. Moeller worked as the Economist at Chancellor Capital Management from 1985 to 1999. There, he developed comprehensive economic forecasts and interpreted economic data for equity and fixed income portfolio managers. Also at Chancellor, Mr. Moeller worked as an equity analyst and was responsible for researching and rating companies in the economically sensitive automobile and housing industries for investment in Chancellor’s equity portfolio. Prior to joining Chancellor, Mr. Moeller was an Economist at Citibank from 1979 to 1984. He also analyzed pricing behavior in the metals industry for the Council on Wage and Price Stability in Washington, D.C. In 1999, Mr. Moeller received the award for most accurate forecast from the Forecasters' Club of New York. From 1990 to 1992 he was President of the New York Association for Business Economists. Mr. Moeller earned an M.B.A. in Finance from Fordham University, where he graduated in 1987. He holds a Bachelor of Arts in Economics from George Washington University.
More Economy in Brief


