 Global| Dec 06 2010
U.S. Payroll Increase Is Disappointing While Jobless Rate Increases
Summary
Recent labor market improvement backpedaled last month. Nonfarm payrolls rose just 39,000 after an upwardly revised 172,000 October increase. The rise disappointed Consensus forecasts for a 142,000 gain. Also disappointing was the [...]
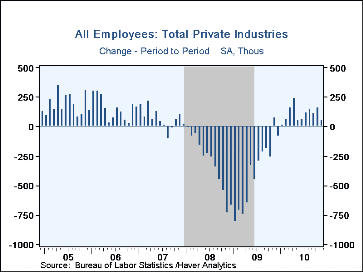
Recent labor market improvement backpedaled last month. Nonfarm payrolls rose just 39,000 after an upwardly revised 172,000 October increase. The rise disappointed Consensus forecasts for a 142,000 gain. Also disappointing was the rise in the unemployment rate to 9.8%, its highest since April. Accompanying the weak headline figures were sequential, discouraging details. The breadth of gain in payrolls fell to just 52% of industries, the lowest of the current expansion. Average hourly earnings were unchanged m/m and the annual gain of 2.1% matched its weakest since 2004.
 Within the establishment survey, indications of
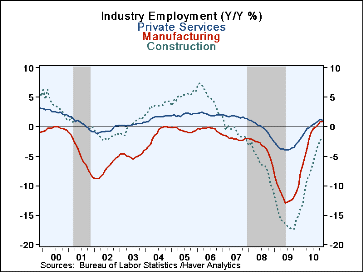
weaker hiring were broad-based. The weakest was the slight 65,000 worker
increase in private service sector hiring. The gain was the smallest since
June. It reflected broadly weaker increases across industries as well as
monthly declines in finance (-1.2% y/y) and retail trade (+0.4% y/y).
Showing the disinterest in hiring full-timers, temporary help jobs rose by
39,500 (19.2% y/y). Continuing to the downside were factory and
construction sector payrolls, though the rates of decline have slowed
significantly from their worst. In the public sector, payrolls fell 11,000
led by a decline (-1.8% y/y) in local gov't jobs which continue to fall
with lower tax revenues. Federal gov't employment rose just 2,000 (0.1%
y/y) as the government continues to face large budget deficits.
Within the establishment survey, indications of
weaker hiring were broad-based. The weakest was the slight 65,000 worker
increase in private service sector hiring. The gain was the smallest since
June. It reflected broadly weaker increases across industries as well as
monthly declines in finance (-1.2% y/y) and retail trade (+0.4% y/y).
Showing the disinterest in hiring full-timers, temporary help jobs rose by
39,500 (19.2% y/y). Continuing to the downside were factory and
construction sector payrolls, though the rates of decline have slowed
significantly from their worst. In the public sector, payrolls fell 11,000
led by a decline (-1.8% y/y) in local gov't jobs which continue to fall
with lower tax revenues. Federal gov't employment rose just 2,000 (0.1%
y/y) as the government continues to face large budget deficits.
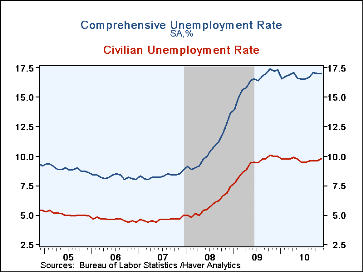
Accompanying the weak payroll figures was the rise to 9.8% in the unemployment rate, as calculated in the household survey. A 9.6% rate had been expected. The increase reflected a 173,000 drop (+0.4% y/y) in employment following a 330,000 October decline. Moreover, a 103,000 increase (0.2%) in the labor force failed to recoup October's drop. The more comprehensive unemployment rate, which includes marginally attached workers and those who work part time but would prefer a full-time job, remained at 17.0%.
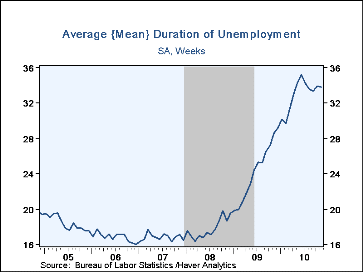
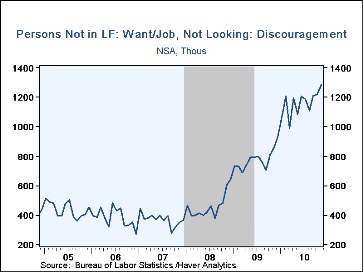
The household survey also showed that those unemployed were jobless for a near-record 33.8 weeks, on average. Forty-two percent of individuals have been unemployed for 27 weeks or longer, down just slightly from the May high. That resulted in a 2.2% rise in the number of individuals not in the labor force, with those "not looking because of discouragement over job prospects" up by nearly one-half y/y. Overall, the civilian participation rate of 64.5% was its lowest since 1984.
The figures referenced above are available in Haver's USECON database. Additional detail can be found in the LABOR and in the EMPL databases.
How Do Sudden Large Losses In Wealth Affect Labor Force Participation? from the Federal Reserve Bank of Chicago can be found here.
| Employment: 000s | Nov. | Oct. | Sept. | Y/Y | 2009 | 2008 | 2007 |
|---|---|---|---|---|---|---|---|
| Payroll Employment | 39 | 172 | -24 | 0.6% | -4.3% | -0.6% | 1.1% |
| Previous | -- | 151 | -41 | -- | -- | -- | -- |
| Manufacturing | -13 | -11 | -6 | 0.8% | -11.3% | -3.4% | -2.0% |
| Construction | -5 | 3 | -11 | -2.0% | -15.7% | -6.1% | -0.8% |
| Private Service Producing | 65 | 157 | 122 | 1.1% | -3.4% | -0.2% | 1.7% |
| Government | -11 | 12 | -136 | -1.1% | 0.2% | 1.3% | 1.1% |
| Average Weekly Hours | 34.3 | 34.3 | 34.2 | 33.9 (Nov.'09) |
33.1 | 33.6 | 33.8 |
| Average Hourly Earnings | 0.0% | 0.4% | 0.1% | 2.1% | 3.0% | 3.8% | 4.0% |
| Unemployment Rate (%) | 9.8 | 9.6 | 9.6 | 10.0 (Nov.'09) | 9.3 | 5.8 | 4.6 |
By Carol Stone
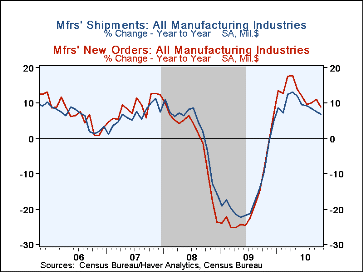
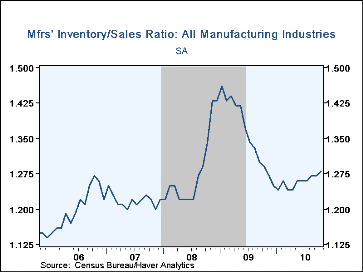
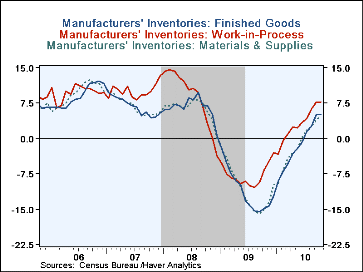
Factory inventories are growing, with October's up 0.9% (+5.8% from a year ago). The inventory/shipments ratio ticked up in October to 1.28 from 1.27 in September; it is about the same as a year ago, but higher than last winter when shipments seemed stronger. Inventories at all three stages of fabrication are rising; the increases in materials & supplies, +4.8% y/y, and work-in-process, +7.7% y/y, suggest that factory managers may believe their demand is moving ahead, so they should rebuild stocks. But the increase in finished goods, +5.1% y/y, could be associated with the recent moderation in shipments, a less desirable development.
Thus, while there are some signs of improving activity, these continue to look quite uneven and tenuous.
The Manufacturers' Shipments, Inventories and Orders (MSIO) data are available in Haver's USECON database.
| U.S. Manufacturing Sector (NAICS, %) | Oct | Sept | Aug | Y/Y | 2009 | 2008 | 2007 |
|---|---|---|---|---|---|---|---|
| Inventories | 0.9 | 1.1 | 0.4 | 5.8 | -8.8 | -0.8 | 7.6 |
| New Orders | -0.9 | 3.0 | 0.0 | 8.9 | -17.8 | -1.0 | 8.7 |
| Shipments | 0.3 | 0.7 | -0.2 | 6.8 | -15.6 | 2.3 | 6.4 |
| Unfilled Orders | 0.6 | 1.3 | 0.2 | 1.8 | -11.1 | 2.8 | 31.2 |
By Tom Moeller
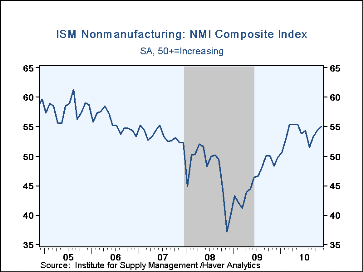
For the third consecutive month the U.S. service sector improved. The November Composite Index for the service and construction sectors from the Institute for Supply Management (ISM) rose to 55.0 from 54.3 in October. The latest beat Consensus expectations for a reading of 54.7 and it remained up from a low of 37.2 late in 2008. Since the series' inception in 1997 there has been a 65% correlation between the level of the composite index in the nonmanufacturing sector and the q/q change in real GDP for the services and the construction sectors.
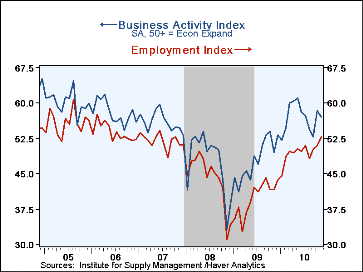
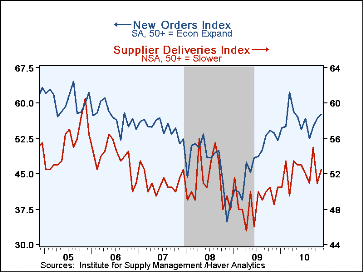
The performance of the components of the ISM Index was mostly positive last month. Only the business activity slipped to 57.0 from its highest level since June. The new orders series rose to its highest since April. Finally, the employment figure increased to the highest level since 2007. Sixteen percent (NSA) of respondents increased hiring while a lessened 11% reported fewer jobs. Since the series' inception in 1997 there has been an 80% correlation between the level of the ISM nonmanufacturing employment index and the m/m change in payroll employment in the service-producing plus the construction industries. The supplier deliveries index increased as delivery speeds slowed a bit.
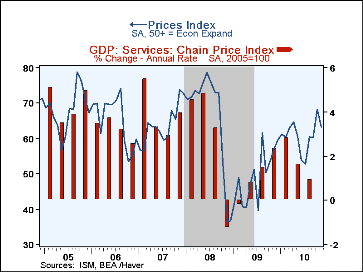
The pricing power index fell back and reversed half of its October increase. A lessened twenty-eight percent of respondents reported higher prices while 5% reported them lower. At the worst, late in 2008, 41% reported lower prices. Since its inception ten years ago, there has been a 71% correlation between the price index and the q/q change in the GDP services chain price index.
Beginning with the January 2008 Nonmanufacturing Report On Business ®, the composite index is calculated as an indication of overall economic conditions for the non-manufacturing sector. It is a composite index based on the diffusion indices of four of the indicators (business activity, new orders, employment and supplier deliveries) with equal weights.
The ISM data are available in Haver's USECON database.
| ISM Nonmanufacturing Survey | Nov. | Oct. | Sept. | Nov. '09 | 2009 | 2008 | 2007 |
|---|---|---|---|---|---|---|---|
| Composite Index | 55.0 | 54.3 | 53.2 | 48.4 | 46.2 | 47.3 | 53.5 |
| Business Activity | 57.0 | 58.4 | 52.8 | 49.6 | 48.0 | 47.4 | 56.0 |
| New Orders | 57.7 | 56.7 | 54.9 | 53.7 | 47.9 | 47.0 | 54.8 |
| Employment | 52.7 | 50.9 | 50.2 | 41.7 | 39.9 | 43.8 | 52.0 |
| Supplier Deliveries (NSA) | 52.5 | 51.0 | 55.0 | 48.5 | 49.0 | 51.1 | 51.1 |
| Prices Index | 63.2 | 68.3 | 60.1 | 57.1 | 49.4 | 66.0 | 63.8 |
by Robert Brusca December 06, 2010
 US and EMU follow same piper - The US and EMU economies are showing progress in their respective nonMFG and services sectors. The chart above shows that the US sector tends to be ahead of the EMU sector by a month or two. Still, it is surprising how closely these two sectors track since they are largely comprised of non-tradable services and do not compete head-to-head.
EMU and US service sector make near-complete 'recovery' - In EMU the index is nearly back to its highest levels since January of 2007 falling short by only 3 points. The US index is back to its peak over that same period. However, each of these sectors had reached even stronger levels in 2005 and 2006, respectively, but we compare 'the recovery' to the more immediate best 'pre-recession' levels not to the highest expansion peaks. Both the US and EMU are still well short of their best expansion peak values from the previous expansion and clearly the sectors have a long way to got to restore normalcy. We are simply looking at the level of activity not at the gain that has been made. The longer these sectors stay at these readings the more gains will be made. At this point getting back to normalcy is more about keeping the indices at current levels than about advancing them further.
All have rebounded, but some by much more - By country the e-Zone shows Germany only one point off its highest level since 2007. Spain and Ireland, among the reporters in this table, lag the most and have risen in each case nearly 20 points from their respective lows; they remain 10 points to 12 points off their best levels of 2007.
Impressive November - The reading for the e-Zone as a whole stands in the 75th percentile of its range between highs and lows. Germany stands at a lofty 90th percentile of its range; both of this metrics are since May of 2000. The rise this month for the Zone is strong, ranking as the 6th strongest EMU services sector gain month-to-month in the last eight and one-half years.
Bullet proof or what? At a time when Europe is supposed to be harmed by financial crisis and ongoing austerity plans the rise is impressively strong – but is it durable?
If we were grading, Most would be in 'D' territory - We can see that most countries are posting far more middling rankings for their service sector standings. These standings line up more or less with the each county's gain in consumer confidence. Since the services sector is the big jobs sector that is not surprising.
Looked at another way... the rich get even richer - If we re-rank the various national indices in their historic queues, instead of calculating their percentile standings between historic high and low values, the region seems much weaker except for Germany; it appears as even stronger.
Bifurcation - The German sector ranked in a queue of values stands in the 96th percentile. In sharp contrast Spain, which, while up sharply from its lowest value, has a current standing that ranks in the bottom five percent of historic service sector readings. Ireland is in the bottom 11 percentile of its queue. France stands in the bottom quartile of its historic range. These are very weak readings and they give the bifurcation in the Zone a whole new look.
Rich relations may give you a crust of bread and such... The bottom line is that there is progress being made in EMU but once again the bifurcated nature of the Zone is revealed. The EMU has become a region of haves and have-nots. Under the German strategy the have-nots are getting financing but are being made to cut their fiscal deficits even more, exacerbating their short term duress which is already considerable.
Resilient for how long? Even so, among the five EMU service sectors we feature in the table four of them improved in November; Ireland, that slipped, did not slip very badly. So far we would have to say the e-Zone has been very resilient. But then the neighboring UK austerity plan is not yet kicking in and several zone countries are still facing a greater pinch of austerity. It seems unlikely that this sort of 'prosperity' will be able to continue... uneven though it is.
Das outlook, Ya! However, Germany with a huge leg up on competitiveness within the zone due to its legacy of low inflation rates is seeing a more robust forecast for the future from the latest estimate put forward by the Bundesbank. The Bundesbank looks for export-led growth to continue. Isn't that special? It appears that the great divide between the euro-haves and the euro-have-nots is about to get even wider. No wonder new reports are about how Germany likes the e-Zone.
Various looks at the UK, EU and EMU Services Sector
Nov-10
Oct-10
Sep-10
3-Mo
6-Mo
12-Mo
%
Euro-Area
55.42
53.35
54.09
54.29
55.01
54.49
72.6%
Germany
59.18
56.04
54.85
56.69
56.42
55.01
90.9%
France
54.96
54.81
58.17
55.98
58.38
57.85
58.2%
Italy
54.45
51.00
51.26
52.24
51.54
52.36
66.4%
Spain
48.26
46.54
47.86
47.55
49.15
49.19
61.4%
Ireland
50.76
50.92
48.78
50.15
52.41
50.75
51.6%
EU only
UK (CIPs)
53.00
53.19
52.80
53.00
52.96
54.55
63.1%
US NONFMG ISM
55.00
54.30
53.20
54.17
53.68
53.47
73.9%
EU Commission Indices for
EU and EMU
EU Index
Nov-10
Oct-10
Sep-10
3Mo
6Mo
12Mo
%
EU Services
8
5
5
-10.33
-12.17
-14.33
67.6%
EMU
Nov-10
Oct-10
Sep-10
3Mo
6Mo
12Mo
%
Services
10
8
8
8.67
7.33
3.71
60.3%
Cons Confidence
-9
-11
-11
-10.33
-12.17
-2.31
67.6%
Consumer Confidence by Country
Germany
11
7
5
7.67
2.67
-5.33
100.0%
France
-17
-17
-18
-17.33
-19.00
-18.75
50.0%
Italy
-22
-22
-22
-22.00
-21.50
-21.00
28.6%
Spain
-21
-20
-19
-20.00
-21.83
-20.67
50.9%
Ireland
#N/A
#N/A
#N/A
#N/A
#N/A
#N/A
#N/A
UK
-18
-16
-17
-17.00
-15.33
-10.83
44.7%
percentile
is over range since May 2000

Robert Brusca
AuthorMore in Author Profile »Robert A. Brusca is Chief Economist of Fact and Opinion Economics, a consulting firm he founded in Manhattan. He has been an economist on Wall Street for over 25 years. He has visited central banking and large institutional clients in over 30 countries in his career as an economist. Mr. Brusca was a Divisional Research Chief at the Federal Reserve Bank of NY (Chief of the International Financial markets Division), a Fed Watcher at Irving Trust and Chief Economist at Nikko Securities International. He is widely quoted and appears in various media. Mr. Brusca holds an MA and Ph.D. in economics from Michigan State University and a BA in Economics from the University of Michigan. His research pursues his strong interests in non aligned policy economics as well as international economics. FAO Economics’ research targets investors to assist them in making better investment decisions in stocks, bonds and in a variety of international assets. The company does not manage money and has no conflicts in giving economic advice.
More Economy in Brief


