 Global| Jan 07 2011
U.S. Payroll Increase Disappoints Again But Unemployment Rate Declines
by:Tom Moeller
|in:Economy in Brief
Summary
The labor market just can't seem to generate a full head of steam. Nonfarm payrolls rose 103,000 last month after upwardly revised gains during the prior two months. But the rise disappointed Consensus forecasts for a 150,000 gain and [...]
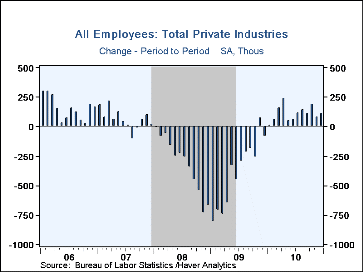
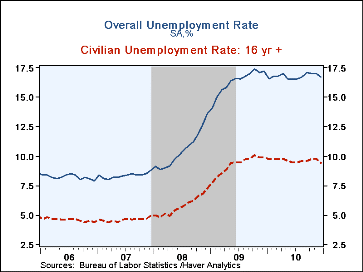
The labor market just can't seem to generate a full head of steam. Nonfarm payrolls rose 103,000 last month after upwardly revised gains during the prior two months. But the rise disappointed Consensus forecasts for a 150,000 gain and it left three-month growth in private payrolls at 1.4% (AR), about where it's been since April. On the positive side of the report was the decline in the unemployment rate to 9.4% versus expectations for 9.7%. Also positive was that 60% of industries added to payrolls, nearly the highest since the Spring.
The 9.4% unemployment rate is derived from the household survey. (Earlier
months' figures reflect benchmark revisions.) The hefty drop from 9.8% reflected a
297,000 increase (+0.9% y/y) in employment
following two months of decline. The labor force fell 260,000 (0.3% y/y) for the
third consecutive monthly decline.
 These drops may reflect the end of the
Census. The more comprehensive unemployment
rate, which includes marginally attached workers and those who work part time
but would prefer a full-time job, fell to 16.7%.
Also from the household survey, the average duration of unemployment rose slightly to 34.2 weeks but remained below its June high of 34.8. Of those unemployed, 44.3% were out of work for 27 weeks or longer. The poor job market caused the labor force participation rate to drop to 64.3%, its lowest since 1984. By educational attainment, the unemployment rate ranged from 15.3% for persons without a high school diploma to 4.8% for those with a college degree or higher.
From the establishment jobs survey, only the private service sector was strong due to gains in education (2.6% y/y), health care (1.9% y/y), leisure & hospitality (1.8% y/y) and retail (0.8% y/y). Factory sector jobs rose moderately (1.2% y/y) but construction (-1.6% y/y) and government jobs fell. Within public sector employment, local jobs were the weakest posting a 20,000 worker decline (-1.8% y/y), while state government jobs were unchanged (0.1% y/y). Federal government hiring rose 10,000 (1.0% y/y).
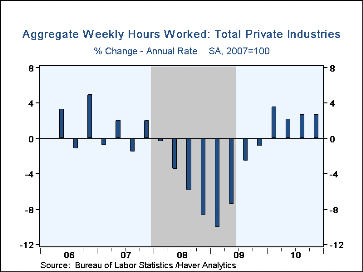
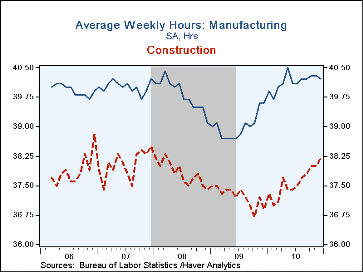
The length of the average workweek in the private sector was unchanged at 34.3 hours though that was up from the 2009 low of 33.7. The improvement has been notable in the factory and construction industries. Aggregate hours worked (employment times hours) rose 0.1% last month and 2.3% (AR) for the quarter.
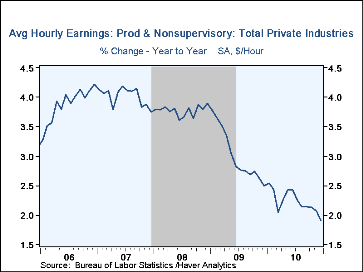
Average hourly earnings again rose just 0.1%, an increase which dropped the y/y gain to a near-record low 1.9%. Wages in the construction sector have been the strongest (2.6% y/y) followed by private services (1.9% y/y) and manufacturing (1.5% y/y).
The figures referenced above are available in Haver's USECON database. Additional detail can be found in the LABOR and in the EMPL databases.
Economic Effects of the Unemployment Insurance Benefit from the Federal Reserve Bank of Philadelphia is available here.
The Economic Outlook and Monetary and Fiscal Policy is today's testimony by Fed Chairman Ben S. Bernanke and it can be found here.
| Employment: 000s | Dec. | Nov. | Oct. | Y/Y | 2010 | 2009 | 2008 |
|---|---|---|---|---|---|---|---|
| Payroll Employment | 103 | 71 | 210 | 0.9% | -0.5% | -4.3% | -0.6% |
| Previous | -- | 39 | 172 | -- | -- | -- | -- |
| Manufacturing | 10 | -8 | -4 | 1.2% | -2.0 | -11.3% | -3.4% |
| Construction | -16 | -2 | 4 | -1.6% | -7.0 | -15.7% | -6.1% |
| Private Service Producing | 115 | 84 | 183 | 1.4% | 0.1 | -3.4% | -0.2% |
| Government | -10 | -8 | 17 | -1.0% | -0.3 | 0.2% | 1.3% |
| Average Weekly Hours | 34.3 | 34.3 | 34.3 | 33.8 (Dec.'09) |
34.2 | 33.1 | 33.6 |
| Average Hourly Earnings | 0.1% | 0.1% | 0.4% | 1.9% | 2.2% | 3.0% | 3.8% |
| Unemployment Rate (%) | 9.4 | 9.8 | 9.7 | 9.9 (Dec.'09) |
9.6 | 9.3 | 5.8 |
Tom Moeller
AuthorMore in Author Profile »Prior to joining Haver Analytics in 2000, Mr. Moeller worked as the Economist at Chancellor Capital Management from 1985 to 1999. There, he developed comprehensive economic forecasts and interpreted economic data for equity and fixed income portfolio managers. Also at Chancellor, Mr. Moeller worked as an equity analyst and was responsible for researching and rating companies in the economically sensitive automobile and housing industries for investment in Chancellor’s equity portfolio. Prior to joining Chancellor, Mr. Moeller was an Economist at Citibank from 1979 to 1984. He also analyzed pricing behavior in the metals industry for the Council on Wage and Price Stability in Washington, D.C. In 1999, Mr. Moeller received the award for most accurate forecast from the Forecasters' Club of New York. From 1990 to 1992 he was President of the New York Association for Business Economists. Mr. Moeller earned an M.B.A. in Finance from Fordham University, where he graduated in 1987. He holds a Bachelor of Arts in Economics from George Washington University.


