 Global| Jun 01 2018
U.S. Payroll & Earnings Growth Improve; Jobless Rate Declines
by:Tom Moeller
|in:Economy in Brief
Summary
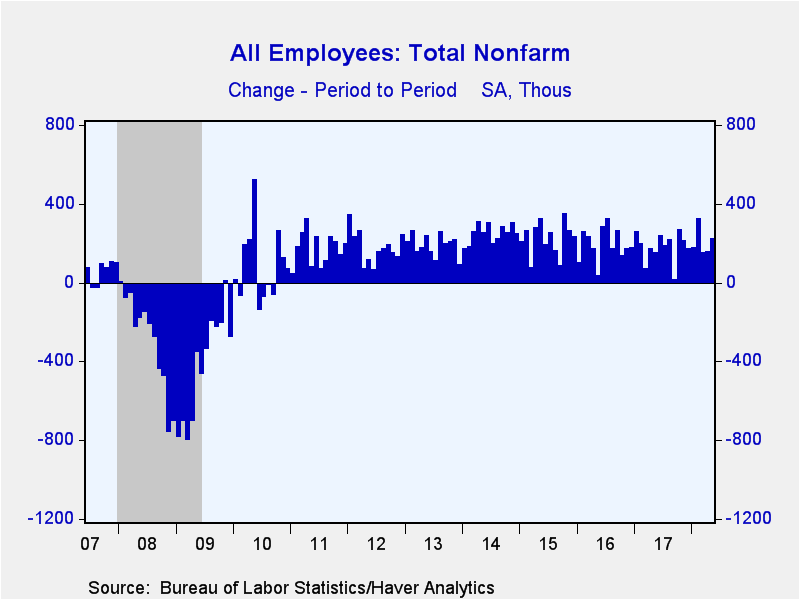
The job market exhibited buoyancy during May. Nonfarm payrolls increased 223,000 following a 159,000 April rise and a 155,000 March increase. Together, payrolls during these two months were revised up 15,000. A 185,000 rise in [...]
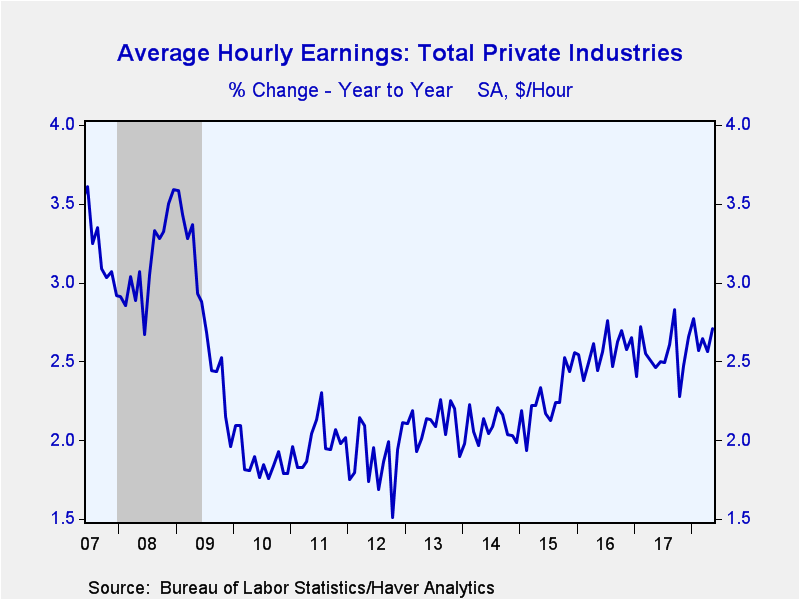
The job market exhibited buoyancy during May. Nonfarm payrolls increased 223,000 following a 159,000 April rise and a 155,000 March increase. Together, payrolls during these two months were revised up 15,000. A 185,000 rise in employment was expected in the Action Economics Forecast Survey. Signs of job market improvement extended to a 0.3% increase (2.7% y/y) in average hourly earnings which followed an unrevised 0.1% uptick. It was the largest gain since January. A 0.2% rise had been expected.
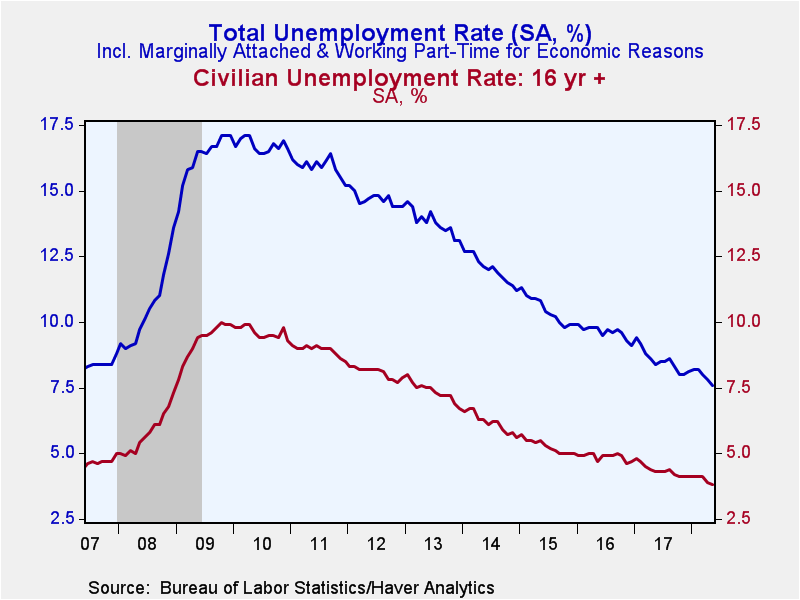
The unemployment rate fell to 3.8%, the lowest level since April 2000. Expectations had been for 3.9%. The total unemployment rate, including marginally attached and working part time for economic reasons fell to 7.6%, equaling its 2001 low.
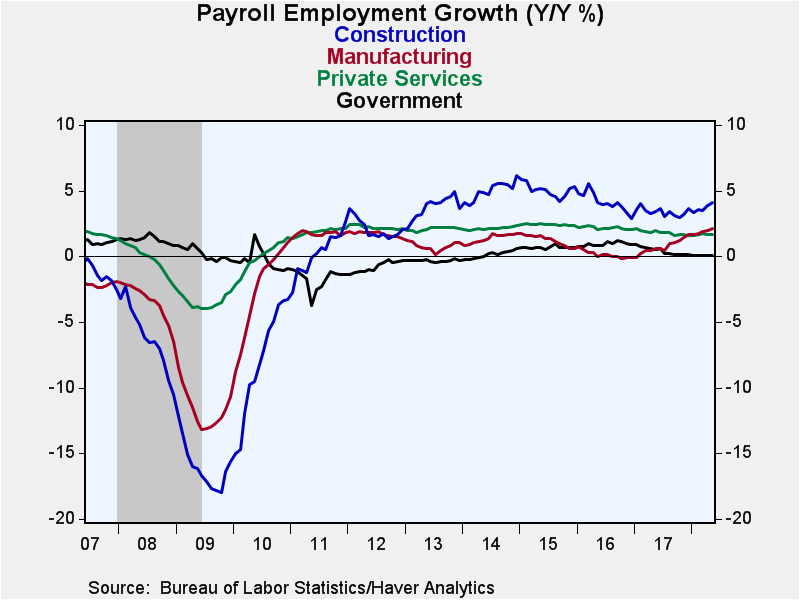
From the payroll employment survey, the 223,000 increase in jobs reflected an 18,000 increase (2.1% y/y) in factory sector jobs which was the weakest gain since September of last year. Construction sector employment offset some of this moderation with a 25,000 rise (4.2% y/y) which was the largest gain in three months. Mining sector jobs gained 5,500 (9.9% y/y), the smallest rise since December.
Employment in private services increased 171,000 (1.7% y/y), the largest rise since February. Employment in trade, transportation & public utilities rose 53,000 (1.3% y/y) following no change in April. Jobs in education and the health services industry increased 39,000 (1.9% y/y), the strongest rise since January. Professional & business service sector employment improved 31,000 (2.4% y/y), the weakest rise since December. Employment in the leisure & hospitality sector grew 21,000 (1.6% y/y), up from 12,000 during the prior month. Financial activities employment grew 8,000 (1.5% y/y), the strongest gain in three months. Employment in the information services sector increased 6,000 (-0.6% y/y). Increases here in the last three months followed monthly declines during most of last year.
Hiring in the government sector rose 5,000 last month but was unchanged y/y. Jobs in local government improved 6,000 (0.5% y/y) after a 3,000 rise. State government employment grew 2,000 (-0.8% y/y) and compared to declines during much of last year. Federal government employment fell 3,000 (-0.9% y/y), about as it did February through April.
Average hourly earnings grew 0.3% (2.7% y/y) reflecting a 0.3% rise (2.8% y/y) in private service-producing industries. The gain was powered by a 1.4% jump (5.6% y/y) in financial industry earnings. Earnings in trade, transportation & utilities grew 0.3% (2.4% y/y). Education & health services earnings grew 0.4% (2.4% y/y) but professional & business services earnings held steady (2.3% y/y). Construction sector earnings improved 0.1% (3.2% y/y), but factory sector pay was unchanged (1.5% y/y).
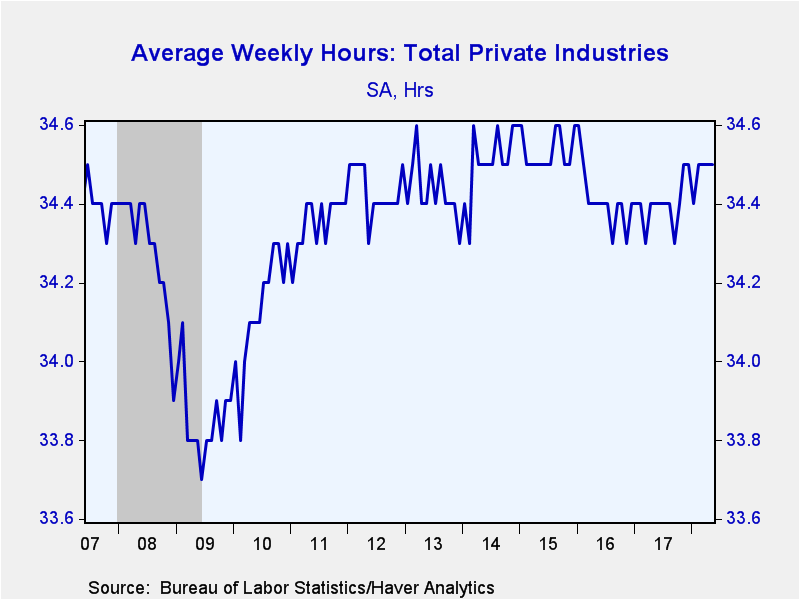 The length of the average workweek held at 34.5 hours, where it's been since
February. Mining sector hours lengthened to 46.1 from a low of 42.8 hours in
March of 2016. Factory sector hours declined to 40.8, the fewest since January.
The construction sector workweek lengthened to 39.6 hours, the most since
December 2015. Hours in private services held steady at 33.3 hours. Financial
activities hours were unchanged at 37.5 while professional & business
services improved to 36.2 hours, equaling the most since January 2016. Education
& health services hours remained at 33.0, the most since October 2008.
Leisure & hospitality hours ticked up m/m to 26.1, about where they've been since early 2016.
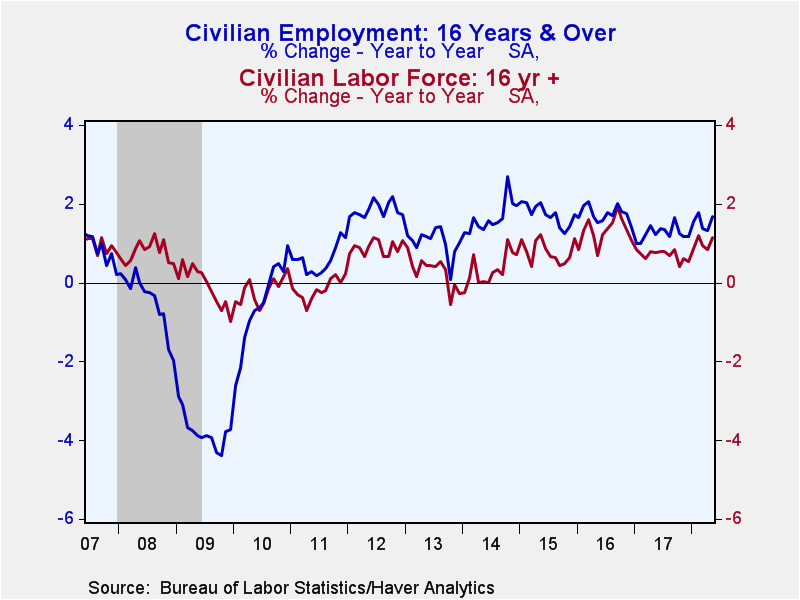
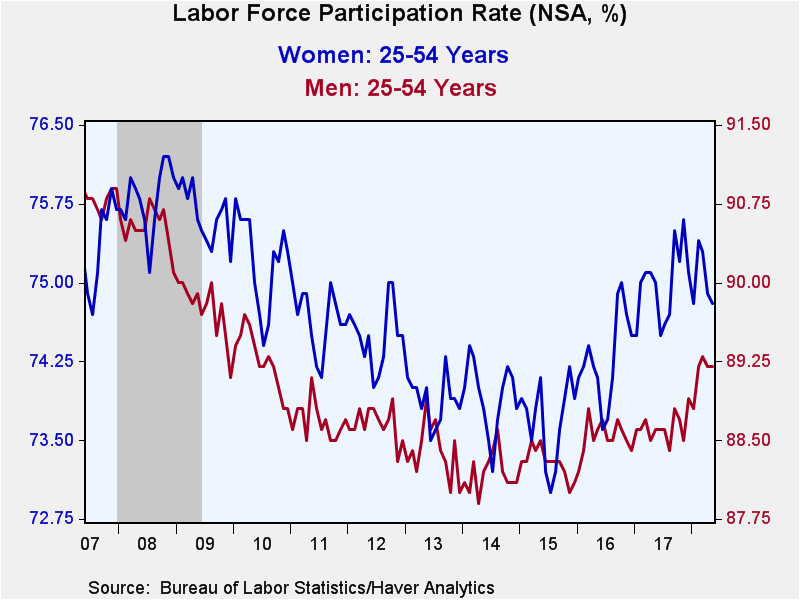
From the household employment survey, the decline in the unemployment rate to 3.8% reflected a 293,000 increase (1.7% y/y) in employment and a 12,000 rise (1.1% y/y) in the labor force. The labor force participation rate declined to 62.7% and equaled the lowest level in two years. The rate for women aged 25-54 eased m/m to 74.8% and for men of that age it held steady m/m at 89.2%. The number of people not in the labor force grew 0.9% y/y, nearly the quickest rate of increase in two years.
By educational attainment, the unemployment rate for those with less than a high school diploma fell to 5.4% from 14.8% averaged in 2010. For high school graduates with no college, it fell to 3.9%, also down from the 2010 high of 10.3%. For those with some college but no degree, the jobless rate declined to an eight year low of 3.2% and for those with a college degree, it was 2.0%.
The teenage unemployment rate fell to a recovery low of 12.8%, down from the 2010 high of 25.9%. For individuals aged 20-24, it was 7.1% versus 15.5% in 2010. For individuals aged 25-54, the rate dropped to 3.1% from 8.6% in 2010, and for those aged 55 or more it fell to 2.8% from 7.0% in 2010.
The labor market data are contained in Haver's USECON database. Detailed figures are in the EMPL and LABOR databases. The expectations figures are in the AS1REPNA database.
| Employment: (SA, M/M Change, 000s) | May | Apr | Mar | May Y/Y | 2017 | 2016 | 2015 |
|---|---|---|---|---|---|---|---|
| Payroll Employment | 223 | 159 | 155 | 1.6% | 1.6% | 1.8% | 2.1% |
| Previous Estimate | -- | 164 | 135 | -- | -- | -- | -- |
| Manufacturing | 18 | 25 | 21 | 2.1 | 0.7 | 0.1 | 1.2 |
| Construction | 25 | 21 | -3 | 4.2 | 2.4 | 4.1 | 5.0 |
| Private Service-Producing | 171 | 109 | 127 | 1.7 | 1.8 | 2.2 | 2.4 |
| Government | 5 | -3 | 2 | 0.0 | 0.4 | 0.9 | 0.7 |
| Average Weekly Hours - Private Sector | 34.5 | 34.5 | 34.5 | 34.4 | 34.4 | 34.4 | 34.5 |
| Private Sector Average Hourly Earnings (%) | 0.3 | 0.1 | 0.2 | 2.7 | 2.5 | 2.6 | 2.3 |
| Unemployment Rate (%) | 3.8 | 3.9 | 4.1 | 4.3 | 4.4 | 4.9 | 5.3 |
Tom Moeller
AuthorMore in Author Profile »Prior to joining Haver Analytics in 2000, Mr. Moeller worked as the Economist at Chancellor Capital Management from 1985 to 1999. There, he developed comprehensive economic forecasts and interpreted economic data for equity and fixed income portfolio managers. Also at Chancellor, Mr. Moeller worked as an equity analyst and was responsible for researching and rating companies in the economically sensitive automobile and housing industries for investment in Chancellor’s equity portfolio. Prior to joining Chancellor, Mr. Moeller was an Economist at Citibank from 1979 to 1984. He also analyzed pricing behavior in the metals industry for the Council on Wage and Price Stability in Washington, D.C. In 1999, Mr. Moeller received the award for most accurate forecast from the Forecasters' Club of New York. From 1990 to 1992 he was President of the New York Association for Business Economists. Mr. Moeller earned an M.B.A. in Finance from Fordham University, where he graduated in 1987. He holds a Bachelor of Arts in Economics from George Washington University.


