 Global| Jul 02 2010
U.S. Nonfarm Payrolls Drop As Census-Hiring Ends; Private-Sector Hiring Again Modest
by:Tom Moeller
|in:Economy in Brief
Summary
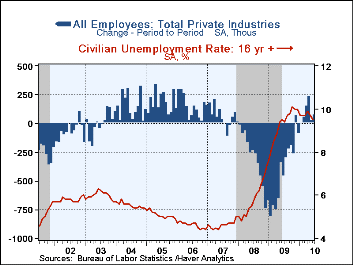
As the 2010 Census ended, 225,000 census jobs were lost. That accounted for most of last month's 125,000 decline in nonfarm payrolls. The 433,000 May increase was little revised but the 313,000 April gain was slightly stronger than [...]
As the 2010 Census ended, 225,000 census jobs were lost. That accounted for most of last month's 125,000 decline in nonfarm payrolls. The 433,000 May increase was little revised but the 313,000 April gain was slightly stronger than initially estimated. Nevertheless, the details of the jobs report do not paint a picture of firming economic growth. First off, the overall June decline was larger than the 110,000 drop expected. Second, the 83,000 increase in private sector jobs was slightly less than expected and it followed a modest 33,000 May increase which was downwardly revised. These gains follow increases of 158,000 and 241,000 in March and April, respectively.
Average weekly hours worked slipped to 34.1 in June. Combined with slim gain in private sector payrolls, aggregate hours worked thus fell last month. However, earlier increases pulled aggregate hours worked for 2Q up at a 3.3% annual rate after the 2.2% gain during 1Q.
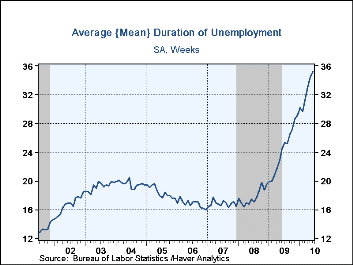
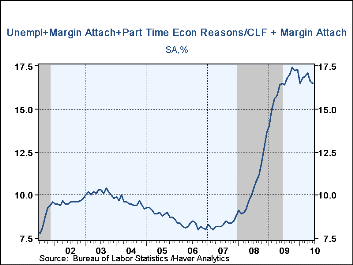
Despite these disappointments, the unemployment rate unexpectedly fell to 9.5% which was the lowest level since July. An increase to 9.8% had been expected. However, the decline occurred as 652,000 individuals (-0.7% y/y) left the labor force. That decline was double the amount that left in May though the number who left but want a job now is off from its December high. Household employment fell 301,000 (-0.7% y/y) after a 35,000 May decline. Therefore, the unemployment rate fell. Labor-market underutilization was further evident in the 16.5% of workers who were either "marginally" attached or involuntarily employed part-time. Even further slack was evident in the average duration of unemployment which rose to a postwar record 35.2 weeks; 45.5% had been unemployed for 27 weeks or more.
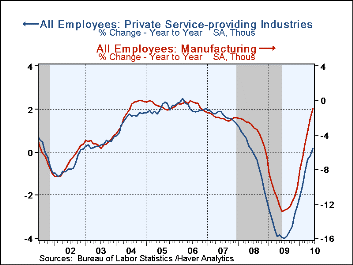
The payroll employment details indicate broad-based weakness in hiring. Factory sector jobs rose by just 9,000 which was the weakest gain this year; held back by declines in electrical equipment (-1.4% y/y) and motor vehicle (+8.8% y/y) jobs. The number of construction jobs fell 22,000 for the fourth decline this year. Amongst private service industries, hiring rose 91,000 but that left the y/y gain anemic at 0.2%. Retail trade jobs fell 6,600 (-0.8% y/y) as did financial activity jobs by 15,000 (-2.0% y/y). Offsetting these losses were higher professional & business service jobs (1.6% y/y), higher health care sector employment (1.9% y/y) and more leisure sector jobs (0.1% y/y). In the government sector, the census lifted federal government hiring. Budget deficits, however, offset this rise and state government jobs fell 2,000 which was the sixth decline in the last eight months (-0.3 y/y). Hiring by municipalities also fell 8,000 which was the sixth decline in the last seven months (-1.2% y/y).
Weakness in hiring left average hourly earnings unchanged last month. A 0.1% uptick had been expected. That pulled the y/y change to 2.3% which was the second weakest gain since 2004. In goods-producing industries, the 12-month rise of 1.9% was accompanied by a 2.5% increase in private service sector earnings.
The figures referenced above are available in Haver's USECON database. Additional detail can be found in the LABOR and in the EMPL databases.
Fiscal Crises of the States: Causes and Consequencesfrom the Federal Reserve Bank of San Francisco can be found here.
| Employment: 000s | June | May | April | Y/Y | 2009 | 2008 | 2007 |
|---|---|---|---|---|---|---|---|
| Payroll Employment | -125 | 433 | 313 | -0.1% | -4.3% | -0.6% | 1.1% |
| Previous | -- | 431 | 290 | -- | -- | -- | -- |
| Manufacturing | 9 | 32 | 38 | -1.0% | -11.3% | -3.4% | -2.0% |
| Construction | -22 | -30 | 22 | -7.4% | -15.7% | -6.1% | -0.8% |
| Private Service Producing | 91 | 20 | 174 | 0.2% | -3.4% | -0.2% | 1.7% |
| Government | -208 | 400 | 72 | 0.9% | 0.2% | 1.3% | 1.1% |
| Average Weekly Hours | 34.1 | 34.2 | 34.1 | 33.8 (June '09) | 33.1 | 33.6 | 33.8 |
| Average Hourly Earnings | 0.0% | 0.3% | 0.3% | 2.3% | 3.0% | 3.8% | 4.0% |
| Unemployment Rate | 9.5 | 9.7% | 9.9% | 9.5%(June '09) | 9.3% | 5.8% | 4.6% |
Tom Moeller
AuthorMore in Author Profile »Prior to joining Haver Analytics in 2000, Mr. Moeller worked as the Economist at Chancellor Capital Management from 1985 to 1999. There, he developed comprehensive economic forecasts and interpreted economic data for equity and fixed income portfolio managers. Also at Chancellor, Mr. Moeller worked as an equity analyst and was responsible for researching and rating companies in the economically sensitive automobile and housing industries for investment in Chancellor’s equity portfolio. Prior to joining Chancellor, Mr. Moeller was an Economist at Citibank from 1979 to 1984. He also analyzed pricing behavior in the metals industry for the Council on Wage and Price Stability in Washington, D.C. In 1999, Mr. Moeller received the award for most accurate forecast from the Forecasters' Club of New York. From 1990 to 1992 he was President of the New York Association for Business Economists. Mr. Moeller earned an M.B.A. in Finance from Fordham University, where he graduated in 1987. He holds a Bachelor of Arts in Economics from George Washington University.
More Economy in Brief
 Global| Feb 05 2026
Charts of the Week: Balanced Policy, Resilient Data and AI Narratives
by:Andrew Cates


