 Global| Mar 26 2007
U.S New Home Sales Plunge – Will the Rest of the Sector Follow?
Summary
New home sales plunged in February and show persistent deceleration but that drop exceeds the weakness in other housing measures (see table on the left). Many economists are looking at the lag difference between existing and new home [...]
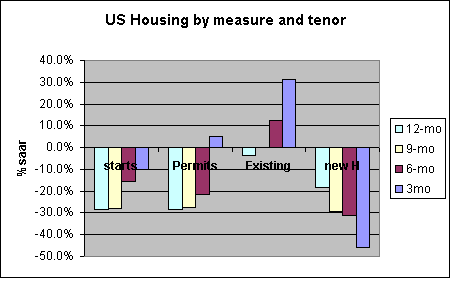
New home sales plunged in February and show persistent deceleration but that drop exceeds the weakness in other housing measures (see table on the left).
Many economists are looking at the lag difference between existing and new home sales. AND maybe that is the right way to look at it. That does not, however, explain the revisions to lower PAST new home sales. I would explain it all differently partly since starts have the same timing asymmetry as new home sales relative to existing home sales and Starts actually rebounded in February. It think the lag is a red herring of sorts, although the existence of a timing asymmetry is a real phenomenon.
It is true that the recording of existing home sales is markedly different from the recording of housing starts and new home sales. Each of the later (New home sales and starts) book at the time of the contract or actual start. But existing home sales are recorded at the end of the transaction when the property legally changes hands – a process that can take one to two months (the gap from sales to closing). Therefore the book on those series in is that new home sales reflect current conditions and existing sales reflected ‘past’ conditions.
But this is not the only difference in these series. Selling a new house is very different from selling an existing house. And let’s see why.
Only builders can sell new houses. Once that house passes to the public it is owned and if it is re-sold or if it is ‘flipped’ – even without being lived-in -- it becomes an existing home sale. So any ‘spec’ seller that owns a home is in competition with builders; some might be selling an identical product (but from a smaller inventory). The inventory size is also a key to understanding the builder. The more homes he has built, and ready to sell, the more reluctant he is to cut price. Since each price cut is like a reduction on ALL the houses he has, that can have a huge negative wealth impact on the builder. But it’s not just on these special cases where builders compete with individuals. New homes sales compete with all existing home sales as well, not just specialized cases where individuals may own a few homes in a builder’s tract.
Next consider existing home sales. These existing home sales do compete with new homes sales. AND for the most part the individuals that are selling houses own only one and are selling it and buying another home (new or used) or renting. They may be motivated sellers or not, for a variety of reasons. But if they are selling with intent to repurchase they are somewhat insulated from weak prices. For example, If you are selling a $400K home to buy a $400K home and if each has a price reduction of 5% how does that hurt you? The answer is that even though there is some balance it does hurt you. For sellers who do not have ‘excess equity in their house a price cut will cost them built up equity and may preclude them from buying the same ‘value of house’ even at a similar lower price.
Consider this: you buy a house for $400,000 and put 20% down ($80,000). So you have a mortgage of $320,000. Now your house price falls by 5% to $380,000. Your equity is reduced to $60,000 as a result ($380,000, the new value less $320,000, the mortgage). So if you wanted to move and buy a similar house to the one you now own, that house would also cost $380,000 but a conventional mortgage would require 20% down or $76,000. Even ignoring all the closing costs and such you now have only $60,000 in equity. Only homeowners with excess equity in their homes will be able to move in this environment or they will have to step down in terms of the quality of house they buy or take a more risky mortgage. Still surveys show that about 60% of the population of homeowners hold more that 50% equity in their house. Despite the drop in equity implied by the calculation above many could still afford to move and the drop in the house they purchase is a wealth buffer of sorts for them, the whole transaction costs them out of pocket cash or put another way forces them to realize their decline in equity.
Even so this is a situation where you get hit on the selling side than helped on the buying side. It is unique to existing homes. Builders are only sellers, so weak prices unambiguously hurt them. This would explain why they would be more reluctant to cut price and why their sales would be hurt more than for existing homes in a downturn. It has nothing to do with the closing Vs the selling lag.
| Permits/Starts | Starts/New Houses | New Houses/Existing Houses | New Houses (-2)/Existing Houses | |
| Max | 1.167 | 2.054 | 0.201 | 0.198 |
| Min | 0.921 | 1.402 | 0.127 | 0.153 |
| Avg | 1.030 | 1.703 | 0.172 | 0.172 |
| Percentile | 34.1% | 60.8% | 0.0% | 7.0% |
| · Let’s looks at some housing ratios to try and see where we stand. The table above presents three. At the bottom we put the ratios in the percentile of their range of values since May of 2002. A value of 100% would be the strongest reading in the range and zero the lowest. The 50% mark is the mid point of the range. · The first is the ratio of housing permits to starts. It is in the 34th percentile of its range of values going back to May of 2000. That means that permits ratio is below its long term average relative to starts by about 16 percentage points. That says that permits are weak relative to starts. It may be that starts are too strong and due to slowdown. · Next, the ratio of starts to new home sales is in its 60th percentile. Starts are a bit strong relative to home sales but only by about 10 percentage points in terms of the normal ratio (the 50th percentile reading marks the norm). This suggests that starts are now slightly stronger than new home sales would suggest and since you have sell them in order to keep building them, it suggests some slowdown in starts might be in order if sales do not pick up. · The third column is shocking. It shows that the ratio of new home to existing home sales is in the bottom of its range. That says new home sales are exceptionally weak relative to existing sales. This suggests that there is a substantial split between these two series. Which one is more out of alignment and why? Just to test and see if it is the lags at work, I have added a last column to the table that looks at new home sales of two months ago Vs existing home sales of this month. Here we are comparing this month’s ‘lagging sales’ on existing homes to the (better conditions) for New Homes of two months ago. Things still do not improve by much. This ratio that adjusts for the lag still leaves the ratio in the bottom 7 percentile of its range. · We conclude that the lag in existing home sales is not the main factor here. We think builders are under re-pricing pressures and not bearing up well. Existing home sales have had an advantage in this market as we discussed above |
|---|
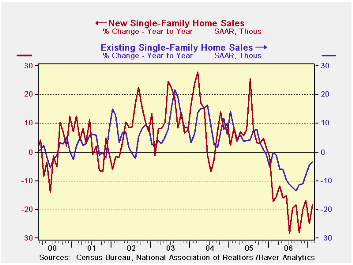 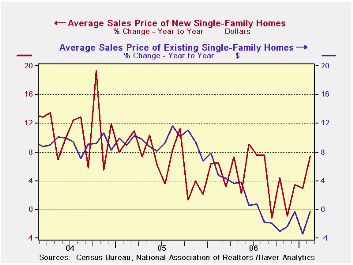 |
| · New homes sales have been the weaker of the two series since early 2006. And that is at least partly because builders have not been cutting prices as much as homeowners have, so new home prices have become relatively more expensive. The ratio of new to existing home prices has risen by 13% since January of 2006. |
|---|

Robert Brusca
AuthorMore in Author Profile »Robert A. Brusca is Chief Economist of Fact and Opinion Economics, a consulting firm he founded in Manhattan. He has been an economist on Wall Street for over 25 years. He has visited central banking and large institutional clients in over 30 countries in his career as an economist. Mr. Brusca was a Divisional Research Chief at the Federal Reserve Bank of NY (Chief of the International Financial markets Division), a Fed Watcher at Irving Trust and Chief Economist at Nikko Securities International. He is widely quoted and appears in various media. Mr. Brusca holds an MA and Ph.D. in economics from Michigan State University and a BA in Economics from the University of Michigan. His research pursues his strong interests in non aligned policy economics as well as international economics. FAO Economics’ research targets investors to assist them in making better investment decisions in stocks, bonds and in a variety of international assets. The company does not manage money and has no conflicts in giving economic advice.
More Economy in Brief


