 Global| Feb 24 2010
U.S. New Home Sales Plumb RecordLow, Weather or Not?
by:Tom Moeller
|in:Economy in Brief
Summary
Whether record snowfall this season hurt housing activity is tough to say. This morning's report that new home sales fell 11.2% from December to 309,000 (AR) following that month's moderate decline suggests that it did, but January [...]
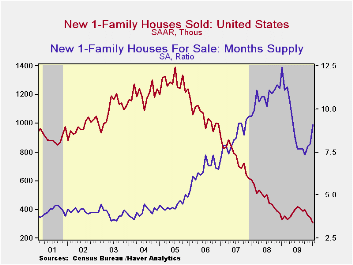 Whether
record snowfall this season hurt housing activity is tough to say. This
morning's report that new home sales fell 11.2% from December to
309,000 (AR) following that month's moderate decline suggests that it
did, but January single-family housing starts were reported last week
to have risen. Perhaps builders have thicker skin than buyers? It
remains to be seen. Nevertheless, January sales fell well short of
Consensus expectations for 355,000 and reached a record low for the
series which dates back to 1963.
Whether
record snowfall this season hurt housing activity is tough to say. This
morning's report that new home sales fell 11.2% from December to
309,000 (AR) following that month's moderate decline suggests that it
did, but January single-family housing starts were reported last week
to have risen. Perhaps builders have thicker skin than buyers? It
remains to be seen. Nevertheless, January sales fell well short of
Consensus expectations for 355,000 and reached a record low for the
series which dates back to 1963.
The one-third m/m drop in home sales in the Northeast certainly suggests a strong weather factor after they rose sharply during December. Conversely, Mid-West sales rose 2.1% following their sharp December decline. In the West, sales drifted lower and neared their record low while sales in the South fell for the fifth month in the last six.
 Home
prices
also were quite weak last month posting a 5.6% decline from December to
$203,500. Prices fell 2.4% during the last twelve months to the lowest
level since late-2003. Since the 2007 peak prices have fallen
22.5%.
Home
prices
also were quite weak last month posting a 5.6% decline from December to
$203,500. Prices fell 2.4% during the last twelve months to the lowest
level since late-2003. Since the 2007 peak prices have fallen
22.5%.
Price discounts had been lowering the inventory of unsold homes, but weakness in sales and stable starts recently have lifted the inventory to its highest level since May. The months' supply of unsold homes also has increased to 11.1 months from its July low of 7.2 months though that remained down from the high of 12.4 months in January '09. Despite the shrinkage of inventory, it still took a record median 13.9 months to sell a new home as of December.
Fed Chairman Ben S. Bernanke's Semiannual Monetary Policy Report to the Congress can be found here.
| US New Homes | January | December | November | Y/Y | 2009 | 2008 | 2007 |
|---|---|---|---|---|---|---|---|
| Total Sales (SAAR, 000s) | 309 | 348 | 362 | -6.1% | 372 | 481 | 769 |
| Northeast | 24 | 37 | 30 | -20.0 | 31 | 35 | 64 |
| Midwest | 49 | 48 | 68 | -7.5 | 54 | 69 | 118 |
| South | 162 | 179 | 187 | -10.5 | 201 | 264 | 409 |
| West | 74 | 84 | 77 | 13.8 | 87 | 113 | 178 |
| Median Price (NSA, $) | 203,500 | 215,600 | 219,100 | -2.4 | 213,567 | 230,408 | 243,742 |
by Tom Moeller February 24, 2010
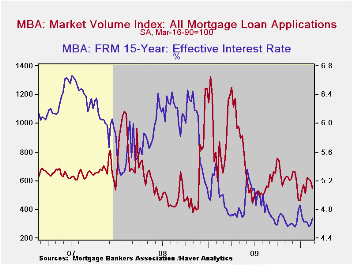 The
housing
market's upturn increasingly looks to have lost steam. The Mortgage
Bankers Association reported that mortgage applications slipped 8.5%
last week for the third week consecutive weekly decline. Nevertheless,
it's not all bad news since a late-January jump in applications was not
wholly unwound. The February average of applications still is up 8.8%
from January.
The
housing
market's upturn increasingly looks to have lost steam. The Mortgage
Bankers Association reported that mortgage applications slipped 8.5%
last week for the third week consecutive weekly decline. Nevertheless,
it's not all bad news since a late-January jump in applications was not
wholly unwound. The February average of applications still is up 8.8%
from January.
For last week, applications to refinance mortgages fell 8.9% and applications to purchase a home fell 7.3%, the third down week. Overall, there has been a downtrend in purchase applications despite an uplift provided by an up-to $8,000 Federal tax credit for first-time homebuyers. During the last ten years there has been a 51% correlation between the y/y change in purchase applications and the change in new plus existing single family home sales. The correlation has lessened recently.
The effective fixed interest rate
on conventional 15-year mortgages moved higher again to 4.68%. For the
month overall rates have been near the six year low. For 30-year
mortgages the rate also ticked up to 5.30% from a November average of
5.06%.  Rates reached a high of 5.79% in early-June. Interest rates on
fixed 15-year and 30-year mortgages are closely correlated (near-90%)
with the rate on 10-year Treasury securities. Rates on adjustable
one-year mortgages fell to 6.64% last week from a November average of
6.81%.
Rates reached a high of 5.79% in early-June. Interest rates on
fixed 15-year and 30-year mortgages are closely correlated (near-90%)
with the rate on 10-year Treasury securities. Rates on adjustable
one-year mortgages fell to 6.64% last week from a November average of
6.81%.
The Mortgage Bankers Association surveys between 20 to 35 of the top lenders in the U.S. housing industry to derive its refinance, purchase and market indexes. The weekly survey covers roughly 50% of all U.S. residential mortgage applications processed each week by mortgage banks, commercial banks and thrifts. Visit the Mortgage Bankers Association site here. The figures for weekly mortgage applications are available in Haver's SURVEYW database.
| MBA Mortgage Applications (SA, 3/16/90=100) | 02/19/10 | 02/12/10 | 02/05/10 | Y/Y | 2009 | 2008 | 2007 |
|---|---|---|---|---|---|---|---|
| Total Market Index | 549.5 | 600.5 | 613.1 | -26.1% | 736.4 | 642.9 | 652.6 |
| Purchase | 196.8 | 212.3 | 221.2 | -21.4 | 263.5 | 345.4 | 424.9 |
| Refinancing | 2,605.3 | 2,860.1 | 2,893.9 | -28.0 | 3,509.2 | 2,394.1 | 1,997.9 |
| 15-Year Mortgage Effective Interest Rate (%) | 4.68 | 4.59 | 4.57 | 5.07 (02/09) | 4.85 | 5.9 | 6.2 |
by Robert Brusca February 24, 2010
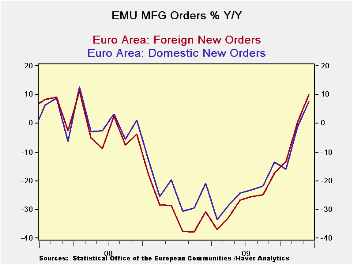
Manufacturing orders are up by 0.8% in December but the sequential growth rates do not show that the growth of orders continues to accelerate. MFG sales are also slowing as capital goods and intermediate goods sales rates over three-months are weaker than sales rates for six months
In December domestic orders have been especially strong rising by 6.1% while foreign orders advanced by 2.2%. But over three months Domestic orders are up at just a 0.8% rate while foreign orders are up at an 11.9% pace. The pattern of growth rates in the chart shows us that domestic and foreign growth rates peaked about six months ago and have since been slowing down even though they continue to grow. This is one reason for concern about whether the recovery is building momentum or not.
Among large EU/EMU countries Italy and the UK are demonstrating still accelerating orders from 12-months to six months and again from six months to the three-month horizon. In France orders accelerated in six months compared to 12-months and have stayed near that mark for 3-month growth rates. Germany shows a decided deceleration with growth rates rising in six-months compared to 12-months then submerging and going negative for the recent three-month period. Still the Yr/Yr growth rates moved sharply higher in December compared to November everywhere but in the UK. But the sequential growth rates do give more of an up-close view of growth and on that basis momentum truly is fading.
Obviously the various EU/EMU countries have some differences. But the overriding message is that orders growth is slowing. It is still positive but it is slowing. Europe now will be burdened with the growing and festering problems of Greece and possibly other debt ladened e-Zone members. The European consumer does not seem to have gotten in gear. The recent German IFO survey was weak but it may have been impacted by weather. We are always on a bit of a weather watch at this time of year. But apart from weather there are ample trends that tell us to be cautious about depending on the European recovery being too strong.
| Selected Euro-Area and UK Industrial Orders | |||||||||
|---|---|---|---|---|---|---|---|---|---|
| Saar except m/m | Mo/Mo | Dec 09 |
Nov 09 |
Dec 09 |
Nov 09 |
Dec 09 |
Nov 09 |
||
| Euro-Area Detail | Dec 09 |
Nov 09 |
Oct 09 |
3Mo | 3Mo | 6mo | 6mo | 12mo | 12mo |
| MFG Orders | 0.8% | 2.7% | -2.1% | 5.6% | 9.2% | 16.9% | 21.5% | 9.5% | -3.2% |
| MFG Sales | -0.4% | 1.4% | 0.4% | 6.1% | 4.3% | 8.8% | 7.9% | -2.8% | -9.2% |
| Consumer | 0.7% | 1.0% | -0.2% | 6.1% | -3.4% | 3.7% | -0.4% | -2.6% | -5.3% |
| Capital | -1.9% | 0.5% | -0.4% | -7.2% | 6.4% | 5.1% | 5.8% | -5.7% | -10.3% |
| Intermediate | 6.1% | 1.3% | -6.8% | 0.8% | 4.1% | 18.6% | 20.0% | 7.7% | -1.1% |
| Memo:MFG | |||||||||
| Total Orders | 0.8% | 2.7% | -2.1% | 5.6% | 9.2% | 16.9% | 21.5% | 9.5% | -3.2% |
| E-13 Domestic MFG orders | 6.1% | 1.3% | -6.8% | 0.8% | 4.1% | 18.6% | 20.0% | 7.7% | -1.1% |
| E-13 Foreign MFG orders | 2.2% | 3.0% | -2.3% | 11.9% | 35.2% | 20.8% | 34.2% | 10.0% | 0.4% |
| Countries: | Dec09 | Nov09 | Oct09 | 3Mo | 3Mo | 6mo | 6mo | 12mo | 12mo |
| Germany (MFG): | -1.8% | 3.2% | -2.1% | -3.4% | 9.9% | 10.3% | 23.7% | 4.2% | -2.0% |
| France(Ind): | 17.1% | 0.5% | -8.2% | 36.4% | -7.3% | 40.5% | 4.5% | 15.5% | -4.2% |
| Italy (Ind): | 4.7% | 2.9% | 0.7% | 38.5% | 47.6% | 18.5% | 15.4% | 5.3% | -3.5% |
| UK (Engineering Industy): | 8.5% | -15.6% | 14.1% | 19.1% | -18.1% | 7.1% | -9.9% | -16.2% | -3.8% |

Tom Moeller
AuthorMore in Author Profile »Prior to joining Haver Analytics in 2000, Mr. Moeller worked as the Economist at Chancellor Capital Management from 1985 to 1999. There, he developed comprehensive economic forecasts and interpreted economic data for equity and fixed income portfolio managers. Also at Chancellor, Mr. Moeller worked as an equity analyst and was responsible for researching and rating companies in the economically sensitive automobile and housing industries for investment in Chancellor’s equity portfolio. Prior to joining Chancellor, Mr. Moeller was an Economist at Citibank from 1979 to 1984. He also analyzed pricing behavior in the metals industry for the Council on Wage and Price Stability in Washington, D.C. In 1999, Mr. Moeller received the award for most accurate forecast from the Forecasters' Club of New York. From 1990 to 1992 he was President of the New York Association for Business Economists. Mr. Moeller earned an M.B.A. in Finance from Fordham University, where he graduated in 1987. He holds a Bachelor of Arts in Economics from George Washington University.
More Economy in Brief


