 Global| Apr 23 2010
U.S. New Home Sales Jump With Tax Credit, But It Still Took A Long Time To Close The Deal
by:Tom Moeller
|in:Economy in Brief
Summary
It's not that an $8,000 home-buyer tax credit alone lifted March new home sales, it's that it will no longer be offered by the Federal government after next week.The result was that new home sales jumped 26.9% from February to 411,000 [...]
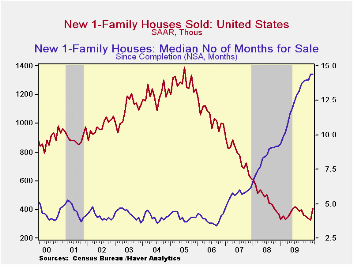
It's not that an $8,000 home-buyer tax credit alone lifted March new home sales, it's that it will no longer be offered by the Federal government after next week.The result was that new home sales jumped 26.9% from February to 411,000 (AR). March sales were the highest level since last July but it followed four consecutive months of decline. The latest greatly exceeded of Consensus expectations for 325,000 sales.
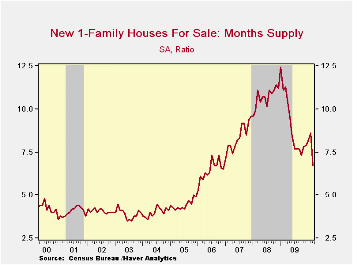
Home prices dipped last month, but that followed a firm February increase. The net-result was a 4.3% price increase versus last March which was the cycle low. Nevertheless, prices remain down 18.5% from the 2007 peak.Price discounts have been lowering the inventory of unsold homes to its lowest level since 1991. At the current sales rate, the months' supply of unsold homes dropped to 6.7 from its 2009 high of 12.4 months. However, despite all this improvement it still took a record median 14.4 months to sell a new home as of March.
A rebound from severe winter weather probably helped sales in the Northeast. They rose by more than one-third from February and were double last year's level. That monthly increase failed, however, to make up the February decline. Sales in South also showed a hefty 43.5% rise m/m but were up just 18.5% from last March. Elsewhere, the credit's positive effect seemed smaller. Sales in the West sales rose 5.7% but they were up by one-quarter from last year while sales in the Mid-west rose just 4.3% after a 13.0% February decline.

| US New Homes | March | February | January | Y/Y | 2009 | 2008 | 2007 |
|---|---|---|---|---|---|---|---|
| Total Sales (SAAR, 000s) | 411 | 324 | 338 | 23.8% | 372 | 481 | 769 |
| Northeast | 38 | 28 | 41 | 100.0 | 31 | 35 | 64 |
| Midwest | 49 | 47 | 54 | 11.4 | 54 | 69 | 118 |
| South | 231 | 161 | 168 | 18.5 | 201 | 264 | 409 |
| West | 93 | 88 | 75 | 25.7 | 87 | 113 | 178 |
| Median Price (NSA, $) | 214,000 | 221,600 | 215,800 | 4.3 | 214,500 | 230,408 | 243,742 |

Tom Moeller
AuthorMore in Author Profile »Prior to joining Haver Analytics in 2000, Mr. Moeller worked as the Economist at Chancellor Capital Management from 1985 to 1999. There, he developed comprehensive economic forecasts and interpreted economic data for equity and fixed income portfolio managers. Also at Chancellor, Mr. Moeller worked as an equity analyst and was responsible for researching and rating companies in the economically sensitive automobile and housing industries for investment in Chancellor’s equity portfolio. Prior to joining Chancellor, Mr. Moeller was an Economist at Citibank from 1979 to 1984. He also analyzed pricing behavior in the metals industry for the Council on Wage and Price Stability in Washington, D.C. In 1999, Mr. Moeller received the award for most accurate forecast from the Forecasters' Club of New York. From 1990 to 1992 he was President of the New York Association for Business Economists. Mr. Moeller earned an M.B.A. in Finance from Fordham University, where he graduated in 1987. He holds a Bachelor of Arts in Economics from George Washington University.
More Economy in Brief


