 Global| Jul 27 2009
U.S. New Home Sales Gain As PricesFall, Again
by:Tom Moeller
|in:Economy in Brief
Summary
Home buyers know a good deal when they see it, and looks like that's what buoyed sales of new homes last month. June sales of new single-family homes increased 11.0% from May to 384,000 after two months of modest increase. Though the [...]
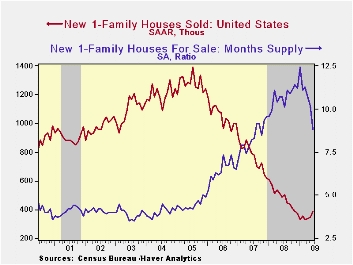
Home buyers know a good deal when they see it, and looks like that's what buoyed sales of new homes last month. June sales of new single-family homes increased 11.0% from May to 384,000 after two months of modest increase. Though the latest sales level was the highest since last November, sales remained down by nearly one-quarter from last June and by nearly three-quarters since the 2005 peak. June sales outpaced Consensus expectations for sales of 352,000 units. The new home sales figures are available in Haver's USECON database.
The firming of home sales last month came as the median sales price fell 5.8% from May to $206,200. That decline reversed virtually all of the gains during the prior two months and left prices down 21.5% from their 2007 high.
The increase in home sales last month was led by a 43.1%
increase in sales in the Midwest. That came on top of a firm gain
during May. Sales in the Northeast also jumped. The 29.2% m/m increase
brought them to the highest level this year. In the West sales also
were quite strong and they rose 22.6% to their highest since July of
last year. Sales in the South did not share the good news. They fell
5.3% to near the record low.
Price weakness again helped move the inventory of unsold homes which is off by one-half since the peak during 2006. In each of the country's regions, inventories are down by roughly one-third just during the last year.Moreover, the month's supply of new homes for sale also has dropped. Despite the low sales rate, in June the months' supply of inventories fell to its lowest level since last July of 2007.
IMF Plans to Inject $250 Billion Into Global Economy from the International Monetary Fund can be found here.
The current economy and the outlook from the Federal Reserve Bank of San Francisco is available here.
| US New Homes | June | May | Y/Y | 2008 | 2007 | 2006 |
|---|---|---|---|---|---|---|
| Total Sales (SAAR, 000s) | 384 | 346 | -21.3% | 479 | 768 | 1,049 |
| Northeast | 31 | 24 | -11.4 | 35 | 64 | 64 |
| Midwest | 73 | 51 | 5.8 | 69 | 118 | 161 |
| South | 177 | 187 | -34.4 | 264 | 408 | 559 |
| West | 103 | 84 | -9.6 | 111 | 178 | 266 |
| Median Price (NSA, $) | 206,200 | 219,000 | -3.4 | 230,408 | 243,742 | 243,067 |
by Robert Brusca July 27, 2009
 BANKS,
MONEY, CREDIT- A number of reports are in the news today
about banking sector issues in lending. With the EMU money and credit
measures just out it’s an appropriate time to survey the background for
lending. The German Zew survey of lending institutions in Germany finds
that larger companies are having the harder time getting credit. Mutual
and cooperative style banks in Germany have been feeding credit more
easily to smaller institutions there.
BANKS,
MONEY, CREDIT- A number of reports are in the news today
about banking sector issues in lending. With the EMU money and credit
measures just out it’s an appropriate time to survey the background for
lending. The German Zew survey of lending institutions in Germany finds
that larger companies are having the harder time getting credit. Mutual
and cooperative style banks in Germany have been feeding credit more
easily to smaller institutions there.
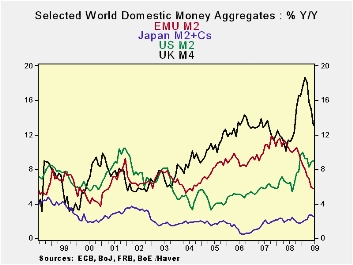
Outside EMU liquidity is expanding - The table and charts at the top of this presentation reveal several the trends. While UK money supply has boomed and busted, its rate of monetary expansion remains the highest among this group of countries and is still barely below its previous recent peak pace in 2006. The US M2 pace spurted in 2008 and has since been locked in an erratic declining growth rate phase. Japan’s money growth hit its low point in 2006 and has since been in a very gradual accelerating trend that recently seems to have flattened out its growth. Japan is still the weakest trend, however.
Special circumstances- In the UK there is a push on to funnel credit to smaller businesses and that seems to be working. In Japan there may be demand side pressures at work as the corporate services price index fell sharply hinting at another round of deflation in Japan. If that takes hold lending in Japan will suffer but mostly from demand side weakness.
ECB is tighter: Europe shows money supply growth peaking in later 2007/early 2008 then steadily decelerating. This is for a period when the rest of the countries were pushing out liquidity at a faster pace. Despite its rate cuts, ECB liquidity in the hands of the public has been consistently squeezed. Europe has its lowest money supply growth since 2004, but it was last persistently weaker than this back in 2001. Despite all its rhetoric about easing and easy money, the ECB has been tightening its monetary grip in quantity terms.
Various horizons: The sequential growth rates for money supply and for credit (in EMU) in the table above make the point. Only EMU has one year money and credit growth so much weaker than the annual rates over two years and three years. For the US, UK and Japan over the recent one year money growth is stronger compared to those earlier horizons. But over six months and three months the US and the UK are seeing weaker money growth than over the longer the periods as is EMU (same goes for credit in EMU). Only Japan is showing stronger money growth more recently.
Real balances: Real balances turn the tables on many of these trends. In terms of real balances Europe’s growth in money is as strong - or stronger - than in the US and the UK over the less than one year horizons. Japan’s growth is the strongest of all over three-and –six months. But the better growth in real balances in Europe is not having the desired impact on credit as residential ‘real’ credit growth has slowed to a crawl while overall loan growth is shrinking in real terms.
Risks still loom: Despite the fact that some lending spreads are back to more of a normal configuration the banking sector is having lingering troubles. We know that housing credit issues like foreclosures usually lag the cycle. Traditionally banks are still involved in dealing with credit hangovers even as the economy improves. But in this instance the degree of economic and credit improvement is not even in train. We are talking about less weakness and better economic signals not of economic growth- at least not yet. While there are some signs of economic and financial stabilization the credit quality and lending scene has continued to deteriorate. So even as we get more optimistic over the results of recent economic indictors we must remain cognizant- as the central banks do – that the banking sector is still in the midst of its big chill. Financial stocks may have recovered from their deathbed valuations and a few banks may have posted large corporate earnings for a quarter, but for the sector at large, substantial risks still loom and some cases the adverse pressures are getting worse.
| Look at Global and Euro Liquidity Trends | |||||||
|---|---|---|---|---|---|---|---|
| Saar-all | Euro Measures (E13): Money & Credit | G-10 Major Markets: Money | Memo | ||||
| €€-Supply M2 | Credit: Resid | Loans | $US M2 | ££UK M4 | ¥¥Jpn M2+Cds | OIL:WTI | |
| 3-MO | 2.9% | 1.0% | 0.0% | 1.7% | -3.7% | 3.3% | 355.2% |
| 6-MO | 2.9% | 1.2% | 0.4% | 5.4% | 6.1% | 3.7% | 162.7% |
| 12-MO | 5.8% | 4.1% | 1.8% | 9.0% | 13.1% | 2.5% | -47.7% |
| 2Yr | 8.1% | 7.7% | 5.8% | 7.6% | 12.3% | 2.3% | 1.8% |
| 3Yr | 8.7% | 8.9% | 7.4% | 7.0% | 12.5% | 2.1% | -0.6% |
| Real Balances: deflated by Own CPI. Oil deflated by US CPI | |||||||
| 3-MO | 2.0% | 0.2% | -0.9% | -1.6% | -5.8% | 5.4% | 340.6% |
| 6-MO | 2.5% | 0.9% | 0.1% | 2.6% | 3.7% | 5.4% | 155.7% |
| 12-MO | 5.9% | 4.2% | 2.0% | 10.3% | 11.1% | 4.1% | -47.1% |
| 2Yr | 6.1% | 5.7% | 3.8% | 5.8% | 9.2% | 2.1% | 0.1% |
| 3Yr | 6.7% | 6.9% | 5.4% | 4.9% | 9.5% | 2.1% | -2.6% |
| Japan CPI for June is an estimate; it uses the May value to produce the real balance figure. | |||||||

Tom Moeller
AuthorMore in Author Profile »Prior to joining Haver Analytics in 2000, Mr. Moeller worked as the Economist at Chancellor Capital Management from 1985 to 1999. There, he developed comprehensive economic forecasts and interpreted economic data for equity and fixed income portfolio managers. Also at Chancellor, Mr. Moeller worked as an equity analyst and was responsible for researching and rating companies in the economically sensitive automobile and housing industries for investment in Chancellor’s equity portfolio. Prior to joining Chancellor, Mr. Moeller was an Economist at Citibank from 1979 to 1984. He also analyzed pricing behavior in the metals industry for the Council on Wage and Price Stability in Washington, D.C. In 1999, Mr. Moeller received the award for most accurate forecast from the Forecasters' Club of New York. From 1990 to 1992 he was President of the New York Association for Business Economists. Mr. Moeller earned an M.B.A. in Finance from Fordham University, where he graduated in 1987. He holds a Bachelor of Arts in Economics from George Washington University.
More Economy in Brief


