 Global| Jan 24 2012
U.S. Natural Gas Price Plumbs A New Low; Petroleum Prices Roughly Stable
by:Tom Moeller
|in:Economy in Brief
Summary
Natural gas prices are continuing their recent slide. Warm temperatures, firm production and abundant inventories have lowered prices to their lowest since February, 2002. Last week's price of $2.40 per mmbtu was down nearly one-half [...]
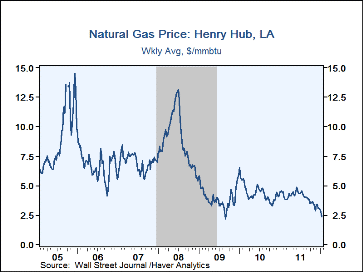
Natural gas prices are continuing their recent slide. Warm temperatures, firm production and abundant inventories have lowered prices to their lowest since February, 2002. Last week's price of $2.40 per mmbtu was down nearly one-half y/y and fell further yesterday to a new low of $2.32. Prices were down versus the early-January, 2010 peak of $6.50.
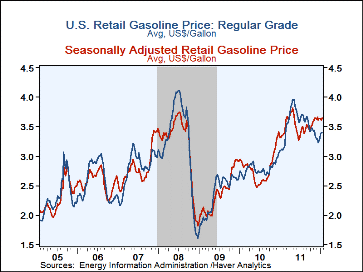
The pump price for regular gasoline was stable last week at $3.39 per gallon. Since their May peak, prices have fallen 57 cents. Retail prices usually decline this time of year with reduced seasonal demand. To account for this pattern, Haver Analytics calculates seasonal factors. As a result, the adjusted gasoline price rose three cents w/w to $3.65. Yesterday, the wholesale price for a gallon of unleaded was $2.80 versus last week's average of $2.82.
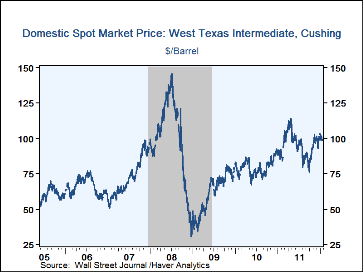
The price for a barrel of light sweet crude slipped last week at $100.04 but remained up sharply from $79.71 averaged during the first week of October. Yesterday, the price fell to $98.18. Prices peaked at $113.93 in late-April. Brent crude also was down last week to $109.89 per barrel and was $109.48 yesterday. Prices peaked earlier at $126.21.
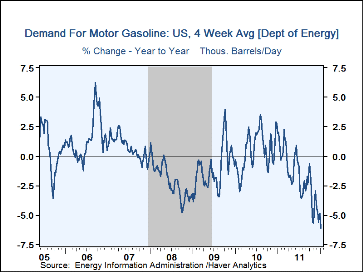
Gasoline demand recently fell 6.1% on average versus last year. Demand for residual fuel oil, used for heating, rose 9.5% y/y and distillate demand fell 4.4%. Inventories of crude oil and petroleum products fell 2.7% year-to-year compared to 10.0% growth in the middle of 2009.
The energy price data are reported by the U.S. Department of Energy and can be found in Haver's WEEKLY database. The daily figures are in DAILY and the gasoline demand figures are in OILWKLY
| Weekly Price | 01/23/12 | 01/16/12 | 01/09/12 | Y/Y% | 2011 | 2010 | 2009 |
|---|---|---|---|---|---|---|---|
| Retail Regular Gasoline ($ per Gallon, Regular) | 3.39 | 3.39 | 3.38 | 9.0 | 3.52 | 2.78 | 2.35 |
| Light Sweet Crude Oil, WTI ($ per bbl.) | 100.04 | 100.44 | 102.39 | 11.4 | 95.14 | 79.51 | 61.39 |
| Natural Gas ($/mmbtu) | 2.40 | 2.80 | 2.92 | -47.7 | 3.99 | 4.40 | 3.95 |
By Tom Moeller
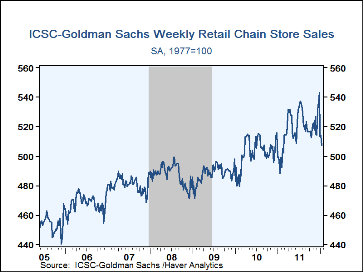
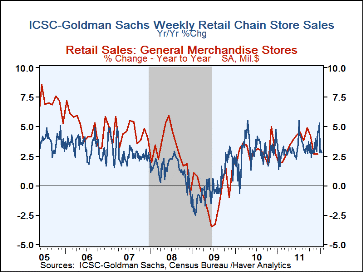
After Christmas, shoppers seem to have turned less jolly. Chain store sales fell 1.4% last week (+2.8% y/y). The decline pulled the January average 3.1% below December when sales rose 1.1%. During the last ten years there has been a 72% correlation between the y/y change in chain store sales and the change in retail sales at general merchandise stores. That correlation recently has increased. General merchandise store sales account for 15% of total retail sales.
The ICSC-Goldman Sachs retail chain-store sales index is constructed using the same-store sales (stores open for one year) reported by 78 stores of seven retailers: Dayton Hudson, Federated, Kmart, May, J.C. Penney, Sears and Wal-Mart. During the last ten years there has been a 69% correlation between the year-to-year growth in chain store sales and the growth in general merchandise retail sales.
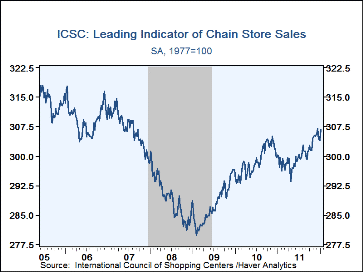
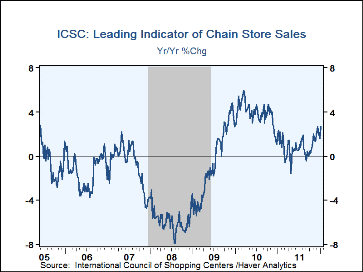
The leading indicator of chain store sales improved 1.1% w/w (2.3% y/y) in the latest period, leaving January so far equal to the December average. The composite leading economic indicator is compiled from four series: (1) The MBA's volume index of mortgage applications for home purchase (2) The ABC News/Money magazine's survey of consumer buying conditions (3) New filings for jobless benefits and (4) The 30-year government bond yield.
The chain store sales data are in Haver's SURVEYW.
How Good Are the Government's Deficit and Debt Projections and Should We Care? from the Federal Reserve Bank of St. Louis can be found here.
| ICSC-UBS (SA, 1977=100) | 01/20/12 | 01/13/12 | 01/06/12 | Y/Y | 2011 | 2010 | 2009 |
|---|---|---|---|---|---|---|---|
| Total Weekly Chain Store Sales | 507.0 | 514.0 | 513.6 | 2.8% | 3.2% | 2.9% | 0.1% |
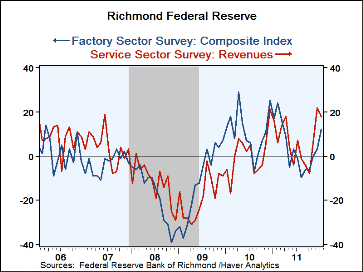
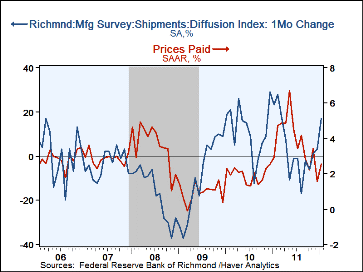
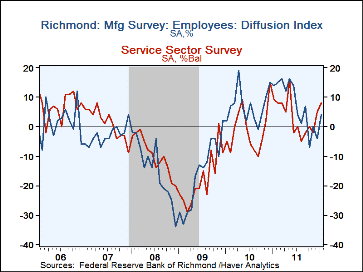
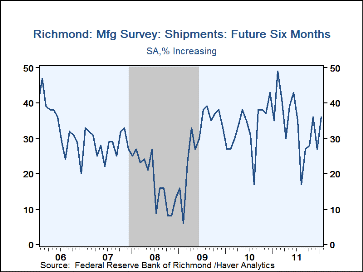
The Federal Reserve Bank of Richmond reported that its Composite Index of Manufacturing Sector Activity improved during January to 12 from 3 in December. The latest was the highest level since March but compared unfavorably to the levels of Q1'11 and Q4'10. The latest m/m gain was led by greatly improved shipments & new orders, as well as higher employment. The index of prices paid also rose moderately but remained down sharply from last year's May high.
Service sector activity did not show the same bounce as did manufacturing. The index of revenues slipped m/m to 18 but remained well up from the negative values of last year. The index for the number of employees, however, advanced to its highest since May. Within the service sector, the retail index of revenues made up a December decline and advanced to its highest level in twelve months. The number of employees index rose moderately but was still well off its 2011 highs. In the nonretail sector, the index fell m/m to 17 but remained well above the negative values of this past October. The employees index also slipped but was up sharply from the summer's negative values. Pricing power in services diminished m/m but still was near its strongest since 2006.
These seasonally-adjusted Richmond Fed figures cover activity in the Mid-Atlantic States of Maryland, North and South Carolina, Virginia and West Virginia. The data is available in Haver's SURVEYS database.
| Richmond Federal Reserve | Jan | Dec | Nov | Jan'11 | 2011 | 2010 | 2009 |
|---|---|---|---|---|---|---|---|
| Manufacturing-Sector Survey (Composite Index) | 12 | 3 | 0 | 17 | 4 | 11 | -11 |
| Shipments | 17 | 3 | 1 | 23 | 3 | 12 | -10 |
| Number of Employees | 4 | -4 | 0 | 14 | 7 | 7 | -16 |
| Prices Paid (Annualized by Respondents, %) | 2.53 | 1.55 | 3.42 | 2.94 | 3.85 | 1.95 | 0.95 |
| Service-Sector Survey (% Increasing Revenues) | 18 | 22 | 6 | 16 | 6 | 1 | -19 |
| Retail Subsector | 23 | 4 | 23 | 46 | -0 | -1 | -16 |
| Non-Retail | 17 | 24 | 11 | 9 | 8 | 2 | -20 |
By Louise Curley
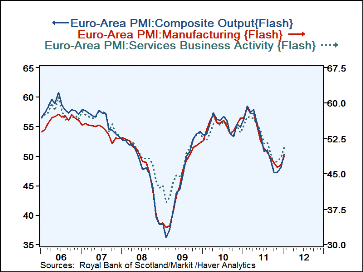
The January "Flash" estimates of the Purchasing Managers' diffusion indexes for the Euro Area continued the increases that began at the end of last year. The Composite index was up 2.7 points to 50.4, the first time the index was in the expansion zone, admittedly barely so. The Manufacturing index increased 1.8 points but was still below the expansion zone. The rise in the Composite was due chiefly to the 2.2 point rise in the services index.& The diffusion indexes for the Euro area are shown in the first chart.
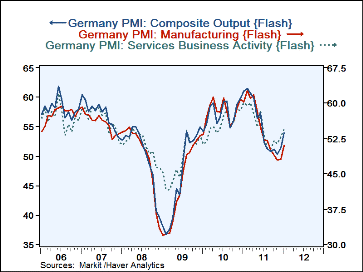
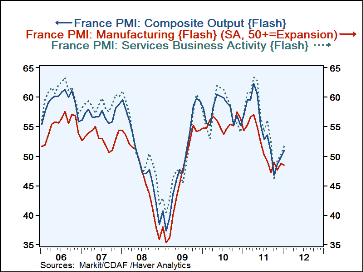
The Euro Area estimates are largely based on the "Flash" estimates of the Composite, Manufacturing and Service indexes for France and Germany, the only countries with complete January data.. The Composite index for France increased a bit more than one point while that in Germany rose 2.6 points between December and January. Both are now in the expansion phase of the cycle, France, barely so at 50.9 and Germany, more solidly at 54.0. In France the manufacturing index actually declined slightly in January while the service index rose 1.5 points. In Germany the manufacturing index was up 2.9 points in January and the service index up 1.8 points. The indexes for Germany and France are shown in the second and third charts
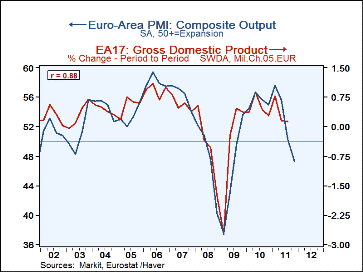
Purchasing Managers' Surveys are good indicators of trends in output. Over the last five years, the correlation between the composite index for the euro area and the quarter to quarter change in the real GDP of the Euro Area has been high, at .91, as can be seen in the fourth Chart. The chart suggests lower growth or even a decline in the fourth quarter rate of GDP growth. However, the increases in the January "Flash" Indexes suggest a more positive outlook for the first quarter of 2012.
| Purchasing Managers' Survey Flash Estimates | Jan 2012 | Dec 2011 | Change |
|---|---|---|---|
| Diffusion Indexes | |||
| Composite | |||
| Euro Area | 50.3529 | 47.9431 | 2.7098 |
| Germany | 53.9806 | 51.3455 | 2.6356 |
| France | 50.9158 | 49.8288 | 1.0870 |
| Manufacturing | |||
| Euro Area | 48.7397 | 46.8980 | 1.8417 |
| Germany | 50.9180 | 48.0550 | 2.8630 |
| France | 48.4966 | 48.7223 | -0.2257 |
| Services | |||
| Euro Area | 50.5320 | 48.3018 | 2.2302 |
| Germany | 54.4930 | 52.7300 | 1.7630 |
| France | 51.6637 | 50.1650 | 1.4987 |

Tom Moeller
AuthorMore in Author Profile »Prior to joining Haver Analytics in 2000, Mr. Moeller worked as the Economist at Chancellor Capital Management from 1985 to 1999. There, he developed comprehensive economic forecasts and interpreted economic data for equity and fixed income portfolio managers. Also at Chancellor, Mr. Moeller worked as an equity analyst and was responsible for researching and rating companies in the economically sensitive automobile and housing industries for investment in Chancellor’s equity portfolio. Prior to joining Chancellor, Mr. Moeller was an Economist at Citibank from 1979 to 1984. He also analyzed pricing behavior in the metals industry for the Council on Wage and Price Stability in Washington, D.C. In 1999, Mr. Moeller received the award for most accurate forecast from the Forecasters' Club of New York. From 1990 to 1992 he was President of the New York Association for Business Economists. Mr. Moeller earned an M.B.A. in Finance from Fordham University, where he graduated in 1987. He holds a Bachelor of Arts in Economics from George Washington University.
More Economy in Brief


