 Global| Jun 23 2010
U.S. Mortgage Applications Recover But Purchase Apps Weak
by:Tom Moeller
|in:Economy in Brief
Summary
Low interest rates continue to prompt firm lending by mortgage bankers. For June so far, The Mortgage Bankers Association reported that applications were up modestly from May and were 13.3% higher than last year despite a slight [...]
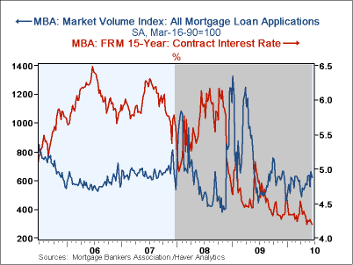 Low interest rates continue to prompt firm lending by mortgage
bankers. For June so far, The Mortgage Bankers Association reported
that applications were up modestly from May and were 13.3% higher
than last year despite a slight decline last week.
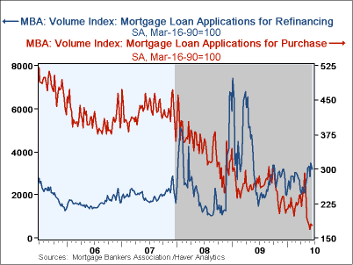
Firm lending activity continued to reflect strong refinancings. Weekly applications for mortgage refinance fell last week. However, so far in June applications rose m/m and were 50% higher than last year.
In the back-wash of the government tax credit's expiration, applications to purchase a home fell 1.2% last week. The decline brought the total drop since a late-April peak to nearly 40%. During the last ten years there has been a 51% correlation between the y/y change in purchase applications and the change in new plus existing single family home sales. The correlation has lessened recently.
The effective fixed interest rate on conventional 15-year mortgages held steady at 4.44% last week, the cycle low. For 30-year mortgages the rate fell slightly to an average 4.96%. Interest rates on fixed 15-year and 30-year mortgages are closely correlated (near-90%) with the rate on 10-year Treasury securities. Rates on adjustable one-year mortgages rose slightly to 7.12%.
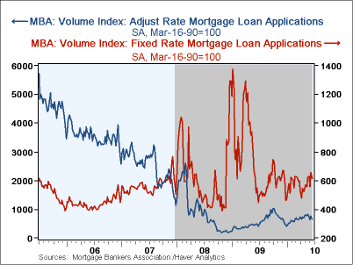
The drop in interest rates prompted increases in both fixed-rate (12.4% y/y and adjustable-rate (33.8% y/y) financing.
The Mortgage Bankers Association surveys between 20 to 35 of the top lenders in the U.S. housing industry to derive its refinance, purchase and market indexes. The weekly survey covers roughly 50% of all U.S. residential mortgage applications processed each week by mortgage banks, commercial banks and thrifts. Visit the Mortgage Bankers Association site here. The figures for weekly mortgage applications are available in Haver's SURVEYW database.
Stressed, Not Frozen: The Federal Funds Market in the Financial Crisis from the Federal Reserve Bank of New York can be found here.
| BA Mortgage Applications (SA, 3/16/90=100) | 06/18/10 | 06/11/10 | 06/04/10 | Y/Y | 2009 | 2008 | 2007 |
|---|---|---|---|---|---|---|---|
| Total Market Index | 621.2 | 659.9 | 560.9 | 13.3% | 736.4 | 642.9 | 652.6 |
| Purchase | 177.9 | 180.0 | 167.8 | -36.5 | 263.5 | 345.4 | 424.9 |
| Refinancing | 3,208.5 | 3,461.5 | 2,859.5 | 51.6 | 3,509.2 | 2,394.1 | 1,997.9 |
| 15-Year Mortgage Effective Interest Rate (%) | 4.44 | 4.44 | 4.49 | 5.21(06/09) | 4.85 | 5.9 | 6.2 |
by Tom Moeller June 23, 2010
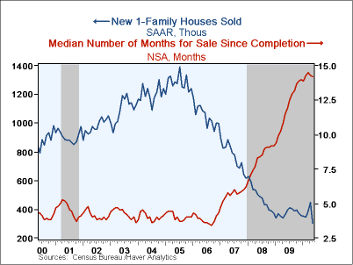 New home sales fell by nearly one-third last month versus April with
the end to the Federal government's $8,000 home-buyer tax credit. New
home sales at 300,000 followed a downwardly revised 446,000
during April. It was a record low for the series which dates back to
1963. The latest level was well short of Consensus expectations for
420,000 sales.
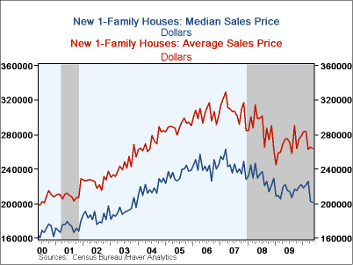
Price discounts accompanied the decline in May sales. The median home price fell 1.0% m/m to $200,900 following April's 10% decline. The latest was the lowest price level since December 2003. The average price of a new home held up at $263,400 (-4.1% y/y).
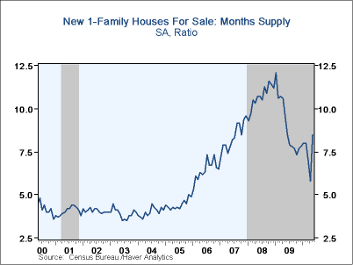
At the current sales rate, the months' supply of unsold homes jumped to 8.5 from 5.8 in April but remained well below the 2009 high of 12.1 months. Moreover, it still took a near-record median 14.2 months to sell a new home during May.
The data in this report are available in Haver's USECON database.
Challenges in Economic Capital Modeling from the Federal Reserve Bank of San Francisco can be found here.
| US New Homes | May | April | March | Y/Y | 2009 | 2008 | 2007 |
|---|---|---|---|---|---|---|---|
| Total Sales(SAAR, 000s) | 300 | 446 | 389 | -18.3% | 372 | 481 | 769 |
| Northeast | 28 | 42 | 33 | 12.0 | 32 | 35 | 64 |
| Midwest | 51 | 67 | 54 | 6.3 | 54 | 69 | 118 |
| South | 170 | 228 | 209 | -16.7 | 201 | 264 | 409 |
| West | 51 | 109 | 93 | -43.3 | 87 | 113 | 178 |
| Median Price(NSA, $) | 200,900 | 202,900 | 225,400 | -9.6% | 214,500 | 230,408 | 243,742 |
by Robert Brusca June 23, 2010
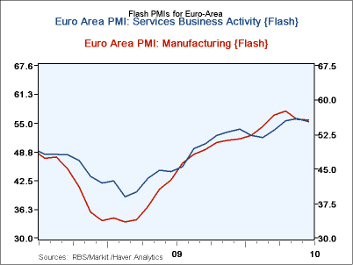 The PMIs are entering a more mature stage of the expansion and steady monthly increases will no longer be the rule nor will such monthly fluctuations be a 'bad signal,' just the result of normal fluctuation.
From April to December of 2008 the Markit PMIs fell. From Dec 2008 though March of 2009 they consolidated at a low level. From March 2009 until August of 2009 they rose, marking a recovery. From Aug 2009-Jan of 2010 the pace of increases slackened in MFG then the rise speeded up though April and now we our first decline in the MFG index. The services PMI is more or less on the same track except in Dec of 2009 it hit a local peak then dropped or moved sideways before renewing its growth.
The MFG reading reached the 89th percentile of its range in April but in May it has slid to the 82nd percentile. The services measure has climbed to the 73rd percentile of its range in May. The MFG index has risen enough that it is near the top of its queue of values. For example in April the MFG reading stood in the 93.7 percentile of queue-that is, it had only been stronger 7% of the time. But the small drop in the index in May has dropped it back to the 89th percentile of its queue. Services lag this performance and reside in the 66th percentile of their queue at the border of the top one-third. Services have a ways to go to restore operation at a top level.
The point is that the steady-to-strong path of month-by-month increases in these indices is a thing of the past. The recovery has matured. Holding to values this high will be good performance in and of itself for manufacturing. We should be careful about assuming that reaching a peak means heading for a new trough as the double-dippers think. It is quite possible for these indicators to stay in a high range for some time. The services gauge still has plenty of room to move up and it should do that as the recovery completes itself. Manufacturing simply has to run at these levels for a while to bring output and jobs in that sector up to past levels.
| FLASH Readings | ||
|---|---|---|
| Markit PMIs for the Euro-Area | ||
| MFG | Services | |
| May-10 | 55.84 | 56.02 |
| Apr-10 | 57.57 | 55.60 |
| Mar-10 | 56.65 | 54.08 |
| Feb-10 | 54.23 | 51.81 |
| Segment averages | ||
| 3-Mo | 56.15 | 55.06 |
| 6-Mo | 53.94 | 53.87 |
| 12-Mo | 50.12 | 51.58 |
| 140-Mo Range | ||
| High | 60.47 | 62.36 |
| Low | 33.55 | 39.24 |
| % Range | 82.8% | 72.6% |
| range: | 26.92 | 23.12 |
| AVERAGE | 51.20 | 53.66 |
Tom Moeller
AuthorMore in Author Profile »Prior to joining Haver Analytics in 2000, Mr. Moeller worked as the Economist at Chancellor Capital Management from 1985 to 1999. There, he developed comprehensive economic forecasts and interpreted economic data for equity and fixed income portfolio managers. Also at Chancellor, Mr. Moeller worked as an equity analyst and was responsible for researching and rating companies in the economically sensitive automobile and housing industries for investment in Chancellor’s equity portfolio. Prior to joining Chancellor, Mr. Moeller was an Economist at Citibank from 1979 to 1984. He also analyzed pricing behavior in the metals industry for the Council on Wage and Price Stability in Washington, D.C. In 1999, Mr. Moeller received the award for most accurate forecast from the Forecasters' Club of New York. From 1990 to 1992 he was President of the New York Association for Business Economists. Mr. Moeller earned an M.B.A. in Finance from Fordham University, where he graduated in 1987. He holds a Bachelor of Arts in Economics from George Washington University.


