 Global| Jul 08 2009
U.S. Mortgage Applications ForPurchase Rise But Applications To Refinance Remain Low
by:Tom Moeller
|in:Economy in Brief
Summary
The Mortgage Bankers Association latest report on mortgage applications provided further evidence that home purchases are recovering but that the refinancing boom is most assuredly over. Overall, mortgage applications recovered 10.9% [...]
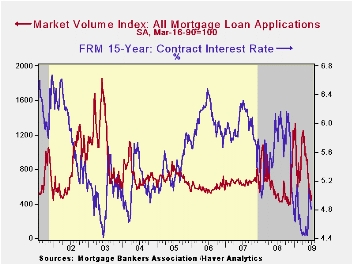
The Mortgage Bankers Association latest report on mortgage applications provided further evidence that home purchases are recovering but that the refinancing boom is most assuredly over. Overall, mortgage applications recovered 10.9% last week and recovered most of the prior week's decline. However, applications nevertheless remained near the lowest level since last November.
The interest in home buying has improved, in part due to distress sales. Purchase applications rose 6.7% last week to the highest level since they spiked in early April. Since the early-February low, purchase application have risen 21.1% as new and existing home sales have recovered.
The interest in refinancing an existing mortgage, conversely, has virtually dried up. Applications to refinance did rise 15.2% last week. However, that made up just half of the prior week's decline and left them at the lowest level since November. Since their peak in January, refinance applications have fallen by three quarters.
Since the beginning of this year, fixed-rate mortgage
applications have fallen by slightly more than one half while
adjustable-rate mortgages have doubled.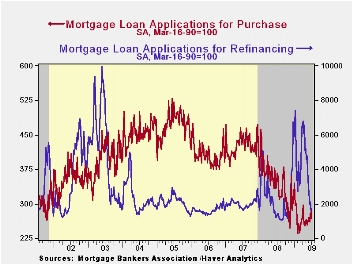
The end of the refinancing boom can be traced, in part, to the rise in interest rates. The effective interest rate on a conventional 15-year mortgage slipped last week to 5.09% but that remained up from the April low of 4.69%. For a 30-year mortgage, the rate also slipped last week to 5.57% but remained up from the 4.81% low. Interest rates on 15- and 30-year mortgages are closely correlated (>90%) with the rate on 10-year Treasury securities. Up also were adjustable 1-Year mortgage rates which remained stable at 6.61% versus the low near 6.0% during January. Nevertheless, the rate remained down from the 7.07% peak reached last fall.
During the last ten years there has been a (negative) 79% correlation between the level of applications for purchase and the effective interest rate on a 30-year mortgage. Moreover, during the last ten years there has been a 61% correlation between the y/y change in purchase applications and the change in new plus existing single family home sales.
The figures for weekly mortgage applications are available in Haver's SURVEYW database.
The Mortgage Bankers Association surveys between 20 to 35 of the top lenders in the U.S. housing industry to derive its refinance, purchase and market indexes. The weekly survey covers roughly 50% of all U.S. residential mortgage applications processed each week by mortgage banks, commercial banks and thrifts. Visit the Mortgage Bankers Association site here.
IMF Moves to Boost Resources to Combat Global Crisis from the International Monetary can be found here
| MBA Mortgage Applications (3/16/90=100) | 07/03/09 | 06/26/09 | Y/Y | 2008 | 2007 | 2006 |
|---|---|---|---|---|---|---|
| Total Market Index | 493.1 | 444.8 | -4.0% | 642.9 | 652.6 | 584.2 |
| Purchase | 285.6 | 267.7 | -21.9% | 345.4 | 424.9 | 406.9 |
| Refinancing | 1,707.1 | 1,482.2 | 23.8% | 2,394.1 | 1,997.9 | 1,634.0 |
German IP Follows Orders Higher
by Robert Brusca July 8, 2009
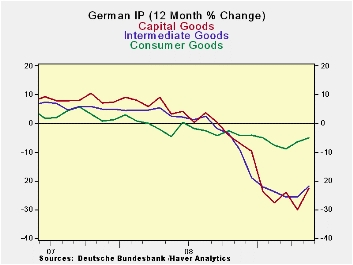
German industrial production rose by 3.7% in May from April. It has risen in two of the last three-months. IP is accelerating, rising at a 5.4% annual rate over three-months compared to a rate of minus 22.2% over six-months and minus 18.1% over twelve-months. Still in the quarter to date IP is contracting at a pace of 6.1%. Two months into the second quarter, despite the stirring in the industrial sector, IP is still a subtraction from growth.
Construction is showing a steady acceleration and positive growth rates over 3-months, 6-months and 12-months. Manufacturing is up at a strong 10% annual rate over three-months but still falling at a 6.6% pace in the current quarter.
Industrial orders are rising on a much more explosive path over this period. But orders are a precursor to increases in output.
Among large EMU countries Spain and the UK also have reported industrial output measures for May. For each of them the May result for MFG output was negative. But MFG output in Spain and in the UK had risen in April. In the UK output is falling at a 0.9% pace in Q2. In Spain output is dropping at a 3% pace in Q2.
These trends have the trappings of a bottoming in progress but not here yet. The German chemicals industry reported that it had made a recession bottom already. For Germany , as a whole, capital goods orders are leading the way out. In May these orders surged by 8.3% compared to April, but that was after a 6.9% plunge in April output itself. Intermediate goods output was up by 4.3% in May. The consumer is not a major factor in the rebound. Output from consumer goods industries is up by 0.6% in May, the second monthly rise in a row, but it is still falling at a pace of 5.4% in Q2. Capital goods output is declining at an 11.5% pace in Q2 and intermediate goods output is falling at a 2.1% pace. There are signs of stirring but no evidence that the real positive thrust is here yet.
Overall there is evidence of the drop in output and the decline in GDP slowing or of a bottom forming and tentative signs of a rise from the lows being put in place for industrial output. The UK reported consumer sentiment rose in June as another sign of optimism in Europe . The G-8 is getting ready to meet and tell us that we have not turned the corner yet. The message from that is for countries not to reverse the stimulus that is in place but a further subtle message is not to commence any new stimulus either.
| Total German IP | Quarter | ||||||
|---|---|---|---|---|---|---|---|
| Saar exept m/m | May-09 | Apr-09 | Mar-09 | 3-mo | 6-mo | 12-mo | to-Date |
| IP total | 3.7% | -2.6% | 0.3% | 5.4% | -22.2% | -18.1% | -8.1% |
| Consumer | 0.6% | 0.5% | -1.0% | 0.4% | -5.7% | -5.0% | -5.4% |
| Capital | 8.3% | -6.9% | 3.7% | 19.1% | -31.2% | -22.6% | -11.5% |
| Intermed | 4.3% | -1.0% | -1.7% | 6.4% | -23.5% | -21.8% | -2.1% |
| Memo | |||||||
| Construction | -3.2% | 0.0% | 6.0% | 11.2% | 5.0% | 1.3% | 14.8% |
| MFG IP | 4.9% | -3.1% | 0.8% | 10.1% | -24.6% | -19.5% | -6.6% |
| MFG Orders | 4.4% | 0.1% | 0.0 | 38.4% | -17.4% | -28.8% | 19.4% |

Tom Moeller
AuthorMore in Author Profile »Prior to joining Haver Analytics in 2000, Mr. Moeller worked as the Economist at Chancellor Capital Management from 1985 to 1999. There, he developed comprehensive economic forecasts and interpreted economic data for equity and fixed income portfolio managers. Also at Chancellor, Mr. Moeller worked as an equity analyst and was responsible for researching and rating companies in the economically sensitive automobile and housing industries for investment in Chancellor’s equity portfolio. Prior to joining Chancellor, Mr. Moeller was an Economist at Citibank from 1979 to 1984. He also analyzed pricing behavior in the metals industry for the Council on Wage and Price Stability in Washington, D.C. In 1999, Mr. Moeller received the award for most accurate forecast from the Forecasters' Club of New York. From 1990 to 1992 he was President of the New York Association for Business Economists. Mr. Moeller earned an M.B.A. in Finance from Fordham University, where he graduated in 1987. He holds a Bachelor of Arts in Economics from George Washington University.
More Economy in Brief


