 Global| Apr 27 2009
U.S. Misery Index Falls Sharply With Lower Energy Prices
by:Tom Moeller
|in:Economy in Brief
Summary
During the past year, the misery index has fallen sharply as a result of the decline in energy prices which have offset the rise in the unemployment rate. During the last three months the decline stalled, however, as the decline in [...]

During the past year, the misery index has fallen sharply as a
result of the decline in energy prices which have offset the rise in
the unemployment rate. During the last three months the decline
stalled, however, as the decline in prices stabilized and unemployment
moved higher. The March index reading of 8.1 compares to 9.6 in 2008.
The so-called misery index is a constructed U.S. business cycle indicator. It adds the year-to-year change in the CPI to the unemployment rate. Thus, for those who are employed it reflects the degree to which their incomes are being eroded by higher prices. For those who are unemployed, it reflects the diminished income and the anxieties produced by a higher level of joblessness.
Lower prices for gasoline (-39.3% y/y) and for heating oil (-30.5% y/y), along with reduced growth in "core" prices (1.8% y/y), have dropped the gain in overall consumer prices to -0.4%. This first negative reading on record has gone some way in bolstering real consumer spending power. That gain works for all consumers, whether employed or unemployed. And it counters the drastic increase in the number of those unemployed as reflected in the rise to 8.5% in the jobless rate, nearly double the low of two years ago.
Along with lower taxes, these forces together recently have combined to lift the gain in real disposable income to 2.2% from 1.3% during all of last year. During the last twenty year there has been a negative 55% correlation between the level of the misery index and the growth of real disposable income.
The misery index can be found in Haver's USECON database under Business Cycle Indicators.
A white paper describing the process and methodologies employed by the federal banking supervisory agencies in their forward-looking capital assessment of large U.S. bank holding companies was published on Friday. It can be found here.
Recession Catches Rural America from the Federal Reserve Bank of Kansas City can be found here.
| U.S. Misery Index | March | February | March '08 | 2008 | 2007 | 2006 |
|---|---|---|---|---|---|---|
| Misery Index | 8.1 | 8.2 | 9.2 | 9.6 | 7.5 | 7.8 |
| Consumer Price Index | -0.4 | 0.1 | 4.1 | 3.8 | 2.9 | 3.2 |
| Unemployment Rate | 8.5 | 8.1 | 5.1 | 5.8 | 4.6 | 4.6 |
by Robert Brusca April 27, 2009
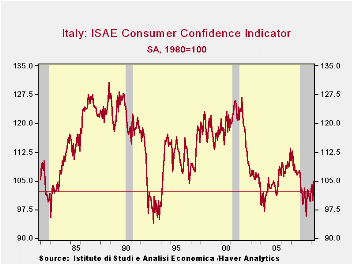
The consumer confidence reading for Italy has been weak in
this cycle but not quite as weak as it was in the previous two
downturns in the early 1980s and early 1990s. Despite the bad press
this business cycle keeps getting, in Italy consumers have not
generally gotten as despondent as in the past two cycles nor have they
stayed as depressed for as long. That is probably against public
perceptions of this recession. Indeed, when I looked at these results I
double checked the spread sheet to see if I’d entered the dates
correctly – and I had. I was (I am!) surprised.
The chart on Italy’s consumer disposition is demonstrating a
clear uptrend, albeit in an oscillating fashion. This month’s reading
is the highest it has been Since December 2007. Moreover the 5.1 point
jump m/m is the fifth largest month-to-month jump in the index since
early 1992. The level of the index is still low but the jump is large.
The rise in the index is notable – especially given the size
of the rise - since Italian unemployment is expected to rise further
and consumer conditions are importantly a reflection of labor market
conditions. In Germany, too, the GfK index of consumer sentiment which
is a survey that projects readings for May shows consumer confidence
unchanged even though last week the leading German research institutes
came out with harsher assessments for the German economy for 2009. For
some reason- and Italian consumers are not alone in this – consumer
confidence is firming in the face of news that is in many ways
worsening.
The devil is in the details -- Italian consumers assess their
own mood with an index value of 104.9 which stands in the 33rd
percentile of its range of values back to January of 1992. The index is
weaker than this level only 27% of the time. So while these are low
readings they are not among the worst ever. The overall situation for
the past 12-months is evaluated as in the 58th percentile of its range,
ranking 121st out of 208 observations leaving it in the bottom 41st
percentile of its range. These statistics give the raw readings more
meaning by putting them in the context of the range of values and in
the context of rankings (frequency). We use ‘the percentile of the
range of value’ instead of ‘percent of mean’ since these components can
move in both positive and negative ranges: ‘percent of mean’ is just
not meaningful. Being in the 58th percentile means that although the
reading is above the mid point of its range it is still a moderate
reading: In fact it appears as an even lower reading in this case since
60% of the time the assessment is better than this. In this way we can
use percentage of range and ranking data to close in on what the
current reading really means
Over the next 12 months the reading for the overall situation
is, however, lower residing in the 20th percentile of its range and
being lower only 16% of the time. By this reading we see that
conditions have not been good and they are expected to get worse.
Still, in the last two recessions these metrics were even worse.
Unemployment for the next 12-months remains very bad, in the 75th
percentile of its range but with the fifth worst reading overall- a
ranking that puts it in the top 3% all time. That is to say that
unemployment fears have been worse than this only 3% of the time.
The household financial situation is in the 38th percentile
for the last 12 months and is expected to be in the 49th percentile of
range for the next 12-months. While 49th percentile is a ‘mid range’
reading that is misleading since the actual reading is lower than that
level only about 17 percent of the time. Apparently the range is wide
and skewed.
Perhaps the real reason Italian consumer sentiment is not so
bad is that Italians remain optimistic about the future, despite their
adverse sentiment. When they assess if it it’s the right time to make a
major purchase they put the current situation in the 40Th percentile of
its range. But when they assess the future they put it in the 95th
percentile of the range. So Italian consumers seem to admit that the
current situation is bad and may get worse in the period ahead. Yet
they remain optimistic that there will be a better time to buy things
in the coming months by a wide margin. Consumer optimism on the time to
make major purchases stands in marked contrast to assessments of the
overall situation for the next 12months as well as to fears of
unemployment and pressures on the household budget. We might be
encouraged to dismiss some of this optimism except we see it arising in
Germany as well. It’s a trend to watch for elsewhere.
| Italy ISAE Consumer Confidence | |||||||
|---|---|---|---|---|---|---|---|
| Since Jan 1992 Rank | |||||||
| Apr-09 | Mar-09 | Feb-09 | Jan-09 | Percentile | Rank | percentile | |
| Consumer Confidence | 104.9 | 99.8 | 104 | 102.6 | 33.4 | 151 | 27.4% |
| Last 12 months | |||||||
| OVERALL SITUATION | -74 | -84 | -78 | -75 | 58.4 | 121 | 41.8% |
| PRICE TRENDS | -43 | -45 | -38.5 | -33.5 | 4.1 | 207 | 0.5% |
| Next 12months | |||||||
| OVERALL SITUATION | -26 | -35 | -26 | -22 | 20.6 | 174 | 16.3% |
| PRICE TRENDS | 9.5 | 7 | 7.5 | 8.5 | 19.4 | 96 | 53.8% |
| UNEMPLOYMENT | 21 | 38 | 28 | 20 | 75.0 | 5 | 97.6% |
| HOUSEHOLD BUDGET | 1 | 5 | 8 | 4 | 17.0 | 198 | 4.8% |
| HOUSEHOLD FIN SITUATION | |||||||
| Last 12 months | -37 | -39 | -35 | -36 | 38.8 | 127 | 38.9% |
| Next12 months | -11 | -10 | -10 | -10 | 49.0 | 172 | 17.3% |
| HOUSEHOLD SAVINGS | |||||||
| Current | 60 | 69 | 66 | 59 | 72.7 | 13 | 93.8% |
| Future | -29 | -33 | -29 | -38 | 40.4 | 159 | 23.6% |
| MAJOR Purchases | |||||||
| Current | -41 | -43 | -39 | -42 | 40.4 | 99 | 52.4% |
| Future | 3 | 3 | 7 | 6 | 95.7 | 3 | 98.6% |
| Total number of months: 208 | |||||||
by Robert Brusca April 27, 2009
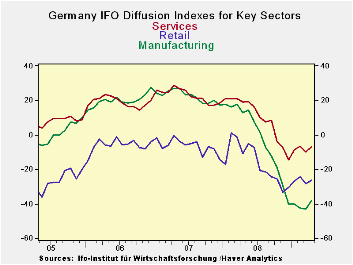
The IFO index in German rose in April sparking some optimism
that the index has made its financial cycle low.
Sectors are improving across the board. MFG improved forma
diffusion reading of -42.9 to -38. Wholesaling improved to -30.6 from
-31.7. Retailing is up to -26.5 from -28.3. Services stands at -7 after
posting a -10 in March. On construction slipped on the month to -24.3
from -22.1.
The IFO diffusion indices are still deeply into negative
territory. The overall index stands in the bottom 5 percentile of its
range. The combination of weakness across sectors is clearly unusual
since the overall IFO is at a lower position in its range than are ANY
of its components. The IFO’s signal joins that of the Zew index and of
the Markit MFG and Services sector indices that point to a turnaround
but continue to embrace very low current readings
| Summary of IFO Sector Diffusion readings: CLIMATE | ||||||||
|---|---|---|---|---|---|---|---|---|
| CLIMATE SUM | Current | Last Mo | Since Jan 1991* | |||||
| Apr-09 | Mar-09 | Average | Median | Max | Min | Range | % Range | |
| All Sectors | -33.1 | -36.2 | -8.8 | -9.3 | 17.5 | -36.2 | 53.7 | 5.8% |
| MFG | -38.0 | -42.9 | -1.3 | 0.4 | 27.5 | -42.9 | 70.4 | 7.0% |
| Construction | -24.3 | -22.1 | -28.9 | -30.3 | 0.7 | -50.1 | 50.8 | 50.8% |
| Wholesale | -30.6 | -31.7 | -14.2 | -16.0 | 24.0 | -38.9 | 62.9 | 13.2% |
| Retail | -26.5 | -28.3 | -15.4 | -15.0 | 21.5 | -40.2 | 61.7 | 22.2% |
| Services | -7.0 | -10.0 | 10.9 | 9.5 | 28.5 | -14.5 | 43.0 | 17.4% |
| * June 2001 for Services | ||||||||

Tom Moeller
AuthorMore in Author Profile »Prior to joining Haver Analytics in 2000, Mr. Moeller worked as the Economist at Chancellor Capital Management from 1985 to 1999. There, he developed comprehensive economic forecasts and interpreted economic data for equity and fixed income portfolio managers. Also at Chancellor, Mr. Moeller worked as an equity analyst and was responsible for researching and rating companies in the economically sensitive automobile and housing industries for investment in Chancellor’s equity portfolio. Prior to joining Chancellor, Mr. Moeller was an Economist at Citibank from 1979 to 1984. He also analyzed pricing behavior in the metals industry for the Council on Wage and Price Stability in Washington, D.C. In 1999, Mr. Moeller received the award for most accurate forecast from the Forecasters' Club of New York. From 1990 to 1992 he was President of the New York Association for Business Economists. Mr. Moeller earned an M.B.A. in Finance from Fordham University, where he graduated in 1987. He holds a Bachelor of Arts in Economics from George Washington University.