 Global| Mar 28 2005
U.S. Liquidity Growth Fell As Interest Rates Rose
by:Tom Moeller
|in:Economy in Brief
Summary
For nearly a year, the Federal Open Market Committee has been targeting a higher level for the Fed funds rate. The latest action lifted the rate to 2.75% versus 1.0% in late June of 2004. These actions have been geared to slowing the [...]

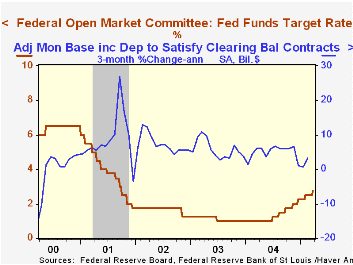
For nearly a year, the Federal Open Market Committee has been targeting a higher level for the Fed funds rate. The latest action lifted the rate to 2.75% versus 1.0% in late June of 2004.
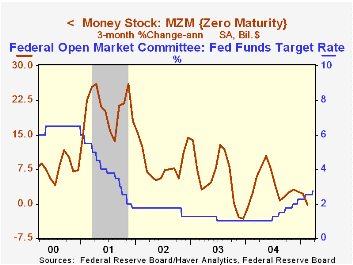
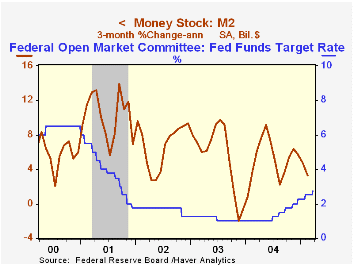
These actions have been geared to slowing the growth of U.S. money & liquidity in order to contain inflationary pressure. Success is evidenced by substantially reduced three-month growth in several monetary aggregates. Growth in narrowly defined money (MZM) was slightly negative in February versus 7.9% growth last June. M2 growth more than halved to 3.3% and growth in adjusted bank reserves fell to 3.3% from 5.9%.
Further evidence of success is noted by "market based" indicators of monetary policy. The slope of the yield curve between Fed funds and the 10 Year Treasury note now is about half its level last June. The foreign exchange value of the US dollar is up 2.0% from its low, though the value against major currencies still is down versus last year. Finally, while industrial commodity prices still are rising, y/y growth including oil has fallen to 5.3% from over 20% last year. 
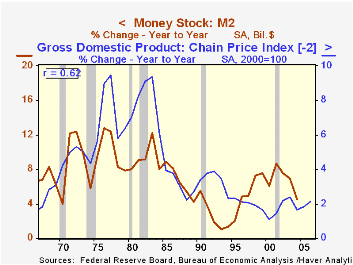
The relationship between money growth and U.S. price inflation has been maligned due to a breakdown during the 1990s. During all of the last thirty years the correlation between annual growth in M2 and the GDP price index two years later has been 62%, but until ten years ago the correlation was over 80%. (These correlations rank high relative to prices' correlation with liquidity or narrow money.)
The Logic of Monetary Policy from Federal Reserve Board Governor Ben S. Bernanke is available here.

| Money & Liquidity | Feb 3 Mth % (AR) | Jan 3 Mth % (AR) | Y/Y | 2004 | 2003 | 2002 |
|---|---|---|---|---|---|---|
| MZM | -0.2% | 2.2% | 3.4% | 3.9% | 7.4% | 12.8% |
| M2 | 3.3% | 4.8% | 5.2% | 4.5% | 6.9% | 7.6% |
| Adjusted Monetary Base | 3.3% | 0.7% | 4.9% | 4.8% | 6.3% | 8.7% |
Tom Moeller
AuthorMore in Author Profile »Prior to joining Haver Analytics in 2000, Mr. Moeller worked as the Economist at Chancellor Capital Management from 1985 to 1999. There, he developed comprehensive economic forecasts and interpreted economic data for equity and fixed income portfolio managers. Also at Chancellor, Mr. Moeller worked as an equity analyst and was responsible for researching and rating companies in the economically sensitive automobile and housing industries for investment in Chancellor’s equity portfolio. Prior to joining Chancellor, Mr. Moeller was an Economist at Citibank from 1979 to 1984. He also analyzed pricing behavior in the metals industry for the Council on Wage and Price Stability in Washington, D.C. In 1999, Mr. Moeller received the award for most accurate forecast from the Forecasters' Club of New York. From 1990 to 1992 he was President of the New York Association for Business Economists. Mr. Moeller earned an M.B.A. in Finance from Fordham University, where he graduated in 1987. He holds a Bachelor of Arts in Economics from George Washington University.
More Economy in Brief
 Global| Feb 05 2026
Charts of the Week: Balanced Policy, Resilient Data and AI Narratives
by:Andrew Cates


