 Global| Jan 05 2005
U.S. Light Vehicle Sales Spurred by Incentives
by:Tom Moeller
|in:Economy in Brief
Summary
Unit sales of light vehicles jumped 12.3% to 18.40M in December, the first m/m gain in three months. The jump was to the highest selling rate in over two years. Consensus expectations had been for sales of 16.9M. Sales of light trucks [...]
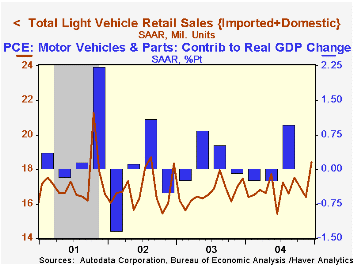
Unit sales of light vehicles jumped 12.3% to 18.40M in December, the first m/m gain in three months. The jump was to the highest selling rate in over two years. Consensus expectations had been for sales of 16.9M.
Sales of light trucks surged 11.7% as both domestic (+11.9% m/m, +0.7% y/y) and imported (+10.2% m/m, +14.6% y/y) trucks benefited from aggressive price discounts.
Total auto sales jumped 13.0% m/m. Sales of domestic autos paced the gain with a 16.2% rise but domestic car sales in 2004 fell for the fifth straight year, down 26.3% since the recent peak in 1994. Sales of imported cars rose 5.7% in December and by 3.0% for the full year.
Imports' share of the US market for new vehicles slipped to 20.0% in December but for the full year was about stable with 2003 at 19.9%.
| Light Vehicle Sales (SAAR, Mil. Units) | Dec | Nov | Y/Y | 2004 | 2003 | 2002 |
|---|---|---|---|---|---|---|
| Total | 18.40 | 16.39 | 5.3% | 16.88 | 16.69 | 16.81 |
| Autos | 8.30 | 7.34 | 9.2% | 7.49 | 7.62 | 8.07 |
| Trucks | 10.11 | 9.05 | 2.4% | 9.39 | 9.01 | 8.74 |
by Tom Moeller January 5, 2005
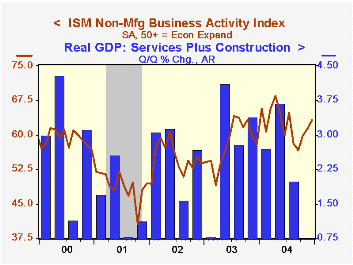
The Business Activity Index for the non-manufacturing sector rose last month for the third straight period to 63.1 from 61.3 in November according to the Institute for Supply Management. Consensus expectations had been for little change at 61.0.
Since the series' inception in 1997 there has been a 55% correlation between the Business Activity Index and the q/q change in GDP services plus construction.
The new orders index recovered most of the prior month's slight decline but at 60.3 remained well off the July high of 66.4.
The employment sub index was about unchanged at 54.9 which also is down from the high of 57.4 set in June. Since the series' inception in 1997 there has been a 60% correlation between the level of the ISM non-manufacturing employment index and the m/m change in payroll employment in the service producing plus the construction industries.
Pricing power remained firm as indicated by the rise in the price index to 71.4, though the index has varied in a range between 67 and 74 since the spring.
ISM surveys more than 370 purchasing managers in more than 62 industries including construction, law firms, hospitals, government and retailers. The non-manufacturing survey dates only to July 1997, therefore its seasonal adjustment should be viewed tentatively.Business Activity Index for the non-manufacturing sector reflects a question separate from the subgroups mentioned above. In contrast, the NAPM manufacturing sector composite index is a weighted average five components.
| ISM Nonmanufacturing Survey | Dec | Nov | Dec '03 | 2004 | 2003 | 2002 |
|---|---|---|---|---|---|---|
| Business Activity Index | 63.1 | 61.3 | 58.0 | 62.5 | 58.1 | 55.1 |
| Prices Index | 71.4 | 71.0 | 60.3 | 68.9 | 56.7 | 53.9 |
by Tom Moeller January 5, 2005
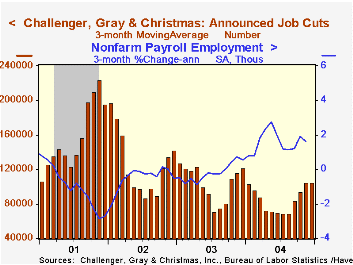
According to Challenger, Gray & Christmas, job cut announcements reported in December rose 4.3% from November and ended the year up 17.2% from a year earlier. Despite these gains, total job cut announcements in 2004 fell 15.9% versus 2003, down for the third consecutive year and were nearly half the peak level in 2001.
During the last ten years there has been an 86% (inverse) correlation between the three month moving average of announced job cuts and the three month change payroll employment.
Job cut announcements differ from layoffs. Many are achieved through attrition, early retirement or just never occur.
Increases in job cut announcements were widespread last month, although they halved in the E-Commerce & Dot com industry and fell also in electronics and services.
| Challenger, Gray & Christmas | Dec | Nov | Y/Y | 2004 | 2003 | 2002 |
|---|---|---|---|---|---|---|
| Announced Job Cuts | 109,045 | 104,530 | 17.2% | 1,039,175 | 1,236,426 | 1,431,052 |
by Tom Moeller January 5, 2005
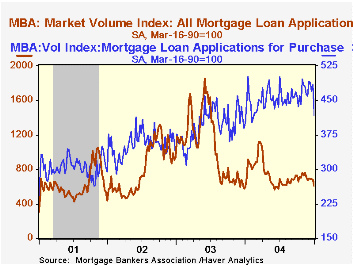
Mortgage applications virtually dried up during the latest week according to the Mortgage Bankers Association (MBA) Survey. A 10.6% decline during the last week of 2004 capped off several weeks of decline, dropped total applications to the lowest level since June and pulled the average level of activity during the year down nearly one third versus 2003.
Applications to purchase weakened notably and fell 13.7% to the lowest level since February. Nevertheless, the average level of purchase applications rose 15.0% last year versus 2003. During the last ten years there has been a 59% correlation between the y/y change in purchase applications and the change in new plus existing home sales.
Refi's fell a lesser 5.7% w/w but that followed a 7.9% decline the prior week and put an end to a year which saw applications to refinance halve versus 2003.
The effective interest rate on a conventional 30-year mortgage fell slightly to 5.94% versus an average 6.05% during 2004. The effective rate on a 15-year mortgage was 5.43% last week versus the 2004 average of 5.47%.
The Mortgage Bankers Association surveys between 20 to 35 of the top lenders in the U.S. housing industry to derive its refinance, purchase and market indexes. The weekly survey accounts for more than 40% of all applications processed each week by mortgage lenders. Visit the Mortgage Bankers Association site here.
The minutes of the latest Federal Open Market Committee meeting can be found here.
"What Determines the Credit Spread?" from the Federal Reserve Bank of San Francisco is available here.
| MBA Mortgage Applications (3/16/90=100) | 01/01/05 | 12/25/04 | Y/Y | 2004 | 2003 | 2002 |
|---|---|---|---|---|---|---|
| Total Market Index | 605.7 | 677.4 | 1.0% | 735.1 | 1,067.9 | 799.7 |
| Purchase | 417.3 | 483.8 | 4.0% | 454.5 | 395.1 | 354.7 |
| Refinancing | 1,701.3 | 1,803.9 | -3.1% | 2,366.8 | 4,981.8 | 3,388.0 |

Tom Moeller
AuthorMore in Author Profile »Prior to joining Haver Analytics in 2000, Mr. Moeller worked as the Economist at Chancellor Capital Management from 1985 to 1999. There, he developed comprehensive economic forecasts and interpreted economic data for equity and fixed income portfolio managers. Also at Chancellor, Mr. Moeller worked as an equity analyst and was responsible for researching and rating companies in the economically sensitive automobile and housing industries for investment in Chancellor’s equity portfolio. Prior to joining Chancellor, Mr. Moeller was an Economist at Citibank from 1979 to 1984. He also analyzed pricing behavior in the metals industry for the Council on Wage and Price Stability in Washington, D.C. In 1999, Mr. Moeller received the award for most accurate forecast from the Forecasters' Club of New York. From 1990 to 1992 he was President of the New York Association for Business Economists. Mr. Moeller earned an M.B.A. in Finance from Fordham University, where he graduated in 1987. He holds a Bachelor of Arts in Economics from George Washington University.
More Economy in Brief


