 Global| Jul 02 2009
U.S. Light Vehicle Sales In JuneHold A Steady, Sideways Movement
by:Tom Moeller
|in:Economy in Brief
Summary
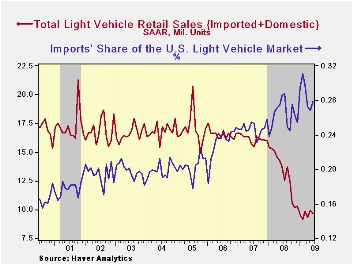
There's no breaking out from a sideways trend for sales of U.S. light vehicles. Certainly that was the case last month as unit vehicle sales slipped 2.3% during June to 9.69 million units (AR). That followed a 6.4% rise during May. [...]
 There's no
breaking out from a sideways trend for sales of U.S. light vehicles.
Certainly that was the case last month as unit vehicle sales slipped
2.3% during June to 9.69 million units (AR). That followed a 6.4% rise
during May. Since February vehicle sales have risen all of 11.7% (3.0%
since January) and recouped just a fraction of last year's 35.6%
decline from December-to-December.
There's no
breaking out from a sideways trend for sales of U.S. light vehicles.
Certainly that was the case last month as unit vehicle sales slipped
2.3% during June to 9.69 million units (AR). That followed a 6.4% rise
during May. Since February vehicle sales have risen all of 11.7% (3.0%
since January) and recouped just a fraction of last year's 35.6%
decline from December-to-December.
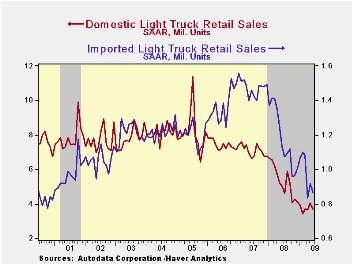
Unit sales of U.S. made light vehicles fell 3.7% to 6.99M units and remained near the lowest since 1982 according to the Autodata Corporation and Ward's Automotive News. (Seasonal adjustment of the figures is provided by the U.S. Bureau of Economic Analysis). Sales of domestically made light trucks fell 7.3% last month to 3.71M units while auto sales ticked up 0.8% m/m to 3.27M units. Sales of domestic vehicles YTD are down 17.3% following last year's 35.3% flop from December-to-December.
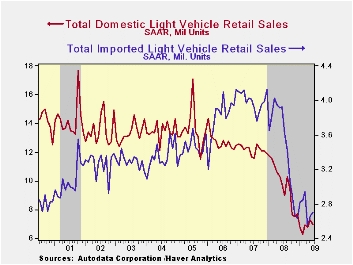 Imported
light vehicle sales
were a bit firmer and posted a 1.5% m/m June increase. Working the
other way versus domestic sales they are up 5.8% year-to-date after the
36.4% 2008 decline. Nevertheless, sales at 2.70M units remained near
their lowest level in roughly ten years. June sales of imported autos
rose 5.1% and were up by more than one-quarter from the December low
while sales of imported light trucks fell 5.3% and gave back most of a
May increase. Sales of imported vehicles YTD have increased 5.8% but
they more than halved last year Dec./Dec.
Imported
light vehicle sales
were a bit firmer and posted a 1.5% m/m June increase. Working the
other way versus domestic sales they are up 5.8% year-to-date after the
36.4% 2008 decline. Nevertheless, sales at 2.70M units remained near
their lowest level in roughly ten years. June sales of imported autos
rose 5.1% and were up by more than one-quarter from the December low
while sales of imported light trucks fell 5.3% and gave back most of a
May increase. Sales of imported vehicles YTD have increased 5.8% but
they more than halved last year Dec./Dec.
 Overall,
import's share of the U.S. light vehicle market increased to
27.9% last month after reaching 26.3% during all of last year.
(Imported vehicles are those produced outside the United States.)
Imports' share of the U.S. car market totaled 35.9%, up slightly from
the 2008 average, while the share of the light truck market was 18.9%,
roughly equal to last year.
Overall,
import's share of the U.S. light vehicle market increased to
27.9% last month after reaching 26.3% during all of last year.
(Imported vehicles are those produced outside the United States.)
Imports' share of the U.S. car market totaled 35.9%, up slightly from
the 2008 average, while the share of the light truck market was 18.9%,
roughly equal to last year.
The U.S. vehicle sales figures can be found in Haver's USECON database.
A View of the Economic Crisis and the Federal Reserve’s Response is yesterday's speech by Janet L. Yellen, President of the Federal Reserve Bank of San Francisco and it can be found here.
| Light Vehicle Sales (SAAR, Mil. Units) | June | May | April | June Y/Y | 2008 | 2007 | 2006 |
|---|---|---|---|---|---|---|---|
| Total | 9.69 | 9.91 | 9.32 | -29.2% | 13.17 | 16.16 | 16.54 |
| Autos | 5.11 | 4.99 | 4.81 | -31.9 | 6.71 | 7.58 | 7.77 |
| Domestic | 3.27 | 3.25 | 3.11 | -30.5 | 4.42 | 5.07 | 5.31 |
| Imported | 1.83 | 1.74 | 1.70 | -34.3 | 2.29 | 2.52 | 2.45 |
| Light Trucks | 4.58 | 4.92 | 4.51 | -25.9 | 6.47 | 8.60 | 8.78 |
| Domestic | 3.71 | 4.01 | 3.67 | -26.5 | 5.29 | 7.10 | 7.42 |
| Imported | 0.87 | 0.91 | 0.84 | -23.3 | 1.18 | 1.47 | 1.37 |
by Tom Moeller July 2, 2009
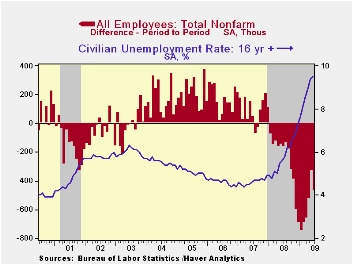
The Bureau of Labor Statistics indicated that the rate of job loss continued to moderate last month, just not by as much as had been anticipated. Nonfarm payrolls fell 467,000 during June after a 322,000 worker decline, revised from -345,000, during May. The June drop was deeper than the market's expectations for a 350,000 shortfall. During this recession so far employment has fallen by a total of 6.5 million, the record for an 18-month period. In percentage terms jobs are down 4.7% since the 2007 peak, also an 18-month record. The moderation is apparent in the 436,000 average monthly decline during the last three versus a peak three-month rate of 701,000 this past Winter.
The latest data from the payroll survey give insight into real GDP growth last quarter. Combined with the lessened decline in employment is a shorter length of the average workweek. Together, this measure of aggregate hours worked fell at a 7.9% annual rate versus an 8.9% 1Q drop. That drop was associated with negative 5.5% real GDP growth. Therefore the 2Q GDP rate of decline likely eased, perhaps sharply depending on productivity growth. During the last twenty years, there has been a 68% correlation between growth in hours worked and in real GDP.
Another indication of moderation in the economy's rate of decline was that the unemployment rate only ticked up slightly. The rise to 9.5% from 9.4% in May was, however, to the highest level since August of 1983. The rate's cycle low of 4.4% occurred in October 2006. Last month employment fell hard again, though here again the rate of decline eased. The 374,000 drop (-3.8% y/y) compared to a peak 1.2 million monthly decline this past January. The labor force fell 155,000 (0.3% y/y). Though the rate of job loss slowed, it also is increasingly difficult for the unemployed to find work. The average duration of unemployment rose during June to a new record of 24.5 weeks from an average of 17.8 weeks during 2008.
Also from the household survey was the continued indication that 5.9 million discouraged workers want a job now but are not in the labor force. That figure is up 19.5% from last June and near the highest since 1995. Finally, the labor force participation rate, i.e., the number of eligible workers who are in the labor force stands at 65.7%, down from the 2000 high of 67.1%.
Back in the establishment survey, the easing in the rate of job loss last month continued evident in slower declines in construction and in services jobs. The construction sector lost 79,000 workers last month after a 48,000 May decline. Monthly drops in excess of 100,000 were common during the prior six. Private service sector job loss also moderated, but just slightly. They fell 192,000 last month after a 97,000 decline May drop. These compare to declines between 196,000 and 399,000 since last September. Losses eased sharply in the retail trade area, in the financial sector and in leisure & hospitality industries. The rate of job loss in the factory sector also eased, but just barely. Factory sector jobs fell 136,000 last month and by an average 147,000 during the last three. That compares with a 205,000 rate of job loss this Winter.
In the government sector there were 52,000 jobs lost last month and they're up just 4,000 this year. That's after the 162,000 worker increase during 2008.Jobs with the Federal government fell by 49,000 (+1.5% y/y) for the second consecutive monthly decline. The number of state gov't jobs fell 4,000 (+0.3% y/y) but local gov't jobs inched up 1,000. Nevertheless, local gov't jobs are down by 0.2% y/y, the first material decline since 1983. Should the federal government bail out the states? Lessons from past recessions from the Federal Reserve Bank of Chicago can be found here.
Not only is the labor market weak in the major categories, but the full breadth of decline shows even greater distress. Overall, only 28.6% of industries posted job gains last month, up from the March low of 19.6%. However, over the last six months just 18.1% of firms posted job growth, up little from the record low since 1990. In the factory sector 13.9% of firms posted job gains and only 6.0% did over the last six months. Both these figures were up from the lows, but just slightly.
Workers' earning power continued to suffer last month from all the hiring distress. Average hourly earnings were unchanged in June for the second month in the last three. That weakness pulled the three-month rate of growth to a record low of just 0.7% (AR). Earnings in the factory sector slipped for the second month and the three-month growth rate dropped to -0.2%. That's versus a late-2008 growth rate of 5.0%. Growth in the durable sector's earnings (NSA) has turned negative over the last three months as have earnings in the private service sector.
The figures referenced above are available in Haver's USECON database. Additional detail can be found in the LABOR and in the EMPL databases.
   |
| Employment: 000s | June | May | April | Y/Y | 2008 | 2007 | 2006 |
|---|---|---|---|---|---|---|---|
| Payroll Employment | -467 | -322 | -519 | -4.1% | -0.4% | 1.1% | 1.8% |
| Previous | -- | -345 | -504 | -- | -- | -- | -- |
| Manufacturing | -136 | -156 | -150 | -12.2% | -3.3% | -2.0% | -0.5% |
| Construction | -79 | -48 | -103 | -13.7% | -5.5% | -0.8% | 4.9% |
| Service Producing | -244 | -107 | -252 | -2.6% | 0.2% | 1.6% | 1.8% |
| Average Weekly Hours | 33.0 | 33.1 | 33.1 | 33.6 (June '08) | 33.6 | 33.8 | 33.9 |
| Average Hourly Earnings | 0.0% | 0.2% | 0.0% | 2.7% | 3.8% | 4.0% | 3.9% |
| Unemployment Rate | 9.5% | 9.4% | 8.9% | 5.6% (June '08) | 5.8% | 4.6% | 4.6% |

Tom Moeller
AuthorMore in Author Profile »Prior to joining Haver Analytics in 2000, Mr. Moeller worked as the Economist at Chancellor Capital Management from 1985 to 1999. There, he developed comprehensive economic forecasts and interpreted economic data for equity and fixed income portfolio managers. Also at Chancellor, Mr. Moeller worked as an equity analyst and was responsible for researching and rating companies in the economically sensitive automobile and housing industries for investment in Chancellor’s equity portfolio. Prior to joining Chancellor, Mr. Moeller was an Economist at Citibank from 1979 to 1984. He also analyzed pricing behavior in the metals industry for the Council on Wage and Price Stability in Washington, D.C. In 1999, Mr. Moeller received the award for most accurate forecast from the Forecasters' Club of New York. From 1990 to 1992 he was President of the New York Association for Business Economists. Mr. Moeller earned an M.B.A. in Finance from Fordham University, where he graduated in 1987. He holds a Bachelor of Arts in Economics from George Washington University.