 Global| Dec 03 2008
U.S. Light Vehicle Sales Fell Further, Lowest Since 1982
by:Tom Moeller
|in:Economy in Brief
Summary
Auto showrooms were even more quiet last month than during October. U.S. sales of light vehicles fell to 10.18 million units (AR), down by more than one-third from the year-ago level. Sales were at their lowest since October 1982 [...]
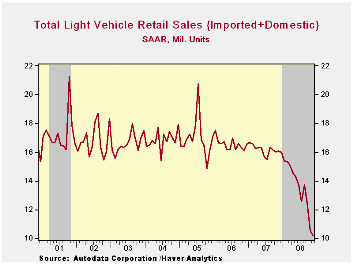
Auto showrooms were even more quiet last month than during October. U.S. sales of light vehicles fell to 10.18 million units (AR), down by more than one-third from the year-ago level. Sales were at their lowest since October 1982 according to the Autodata Corporation and Ward's Automotive News. (Seasonal adjustment of the figures is provided by the U.S. Bureau of Economic Analysis). The 3.6% m/m decline last month came on top of the 15.5% flop during October.
Unit sales so far this year have averaged a 13.44M annual
selling rate, down 16.9% from the first eleven months of last year. The
level of November vehicle purchases was even weaker than Consensus
expectations for sales of 10.4M.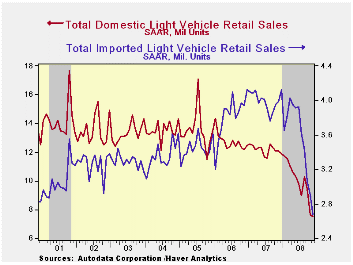
Sales of domestically made light vehicles fell 1.9% to 7.05M units after the nearly 20% October slide. Domestic vehicle sales are off 38% y/y. Year-to-date, sales were down 18.9% on average from the first eleven months of last year. Domestically made light truck sales recovered all of a 5.3% October fall after 22.0% and 11.8% m/m declines during the prior two months. Truck sales this year were off by nearly one quarter from the first eleven months of 2007. Sales of U.S. made cars also have been quite weak and fell 10.0% after declines of 15.2% during October and 3.7% the month prior. As drivers continued to shift purchases to relatively fuel efficient vehicles, car sales were down a relatively moderate 11.2% versus the first eleven months of last year.
Sales of imported light vehicles continued to reflect economic recession in the U.S. and fell 8.0% last month (-33.0% y/y) to 2.67M units. That shortfall followed declines during six of the prior seven months. The latest was the lowest level since December 1999.Sales of imported autos more than reversed their October uptick and fell 12.4% to 1.71M units, off a moderate 6.4% from the first eleven months of last year.Sales of imported light truck sales ticked up 0.9% (-34.9% y/y) and were off 19.0% from the first eleven months of last year.
Import's share of the U.S. light vehicle market fell to 26.2% of the U.S. vehicle market. (Imported vehicles are those produced outside the U.S. and do not include vehicles with the nameplate of a foreign manufacturer produced within the U.S.)
Who really made your car? from the Federal Reserve Bank of Chicago is available here.
Economy in lower gear through 2008 also from the Federal Reserve Bank of Chicago can be found here.
| Light Vehicle Sales (SAAR, Mil. Units) | November | October | Y/Y | 2007 | 2006 | 2005 |
|---|---|---|---|---|---|---|
| Total | 10.18 | 10.56 | -36.7% | 16.17 | 16.54 | 16.96 |
| Autos | 4.95 | 5.55 | -37.0 | 7.58 | 7.77 | 7.65 |
| Domestic | 3.24 | 3.60 | -39.3 | 5.07 | 5.31 | 5.40 |
| Imported | 1.71 | 1.95 | -31.9 | 2.51 | 2.45 | 2.25 |
| Light Trucks | 5.23 | 5.01 | -36.4 | 8.60 | 8.78 | 9.32 |
| Domestic | 4.26 | 4.05 | -36.8 | 7.12 | 7.42 | 8.12 |
| Imported | 0.97 | 0.96 | -35.5 | 1.48 | 1.37 | 1.20 |
by Tom Moeller December 3, 2008
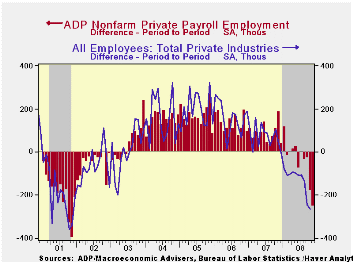
The payroll processor ADP indicated in its latest National
Employment Report that October private nonfarm payrolls fell 250,000
after a revised 179,000 October shortfall that was deeper than the
initial estimate. The latest was the fifth decline in the last six
months and it was the largest since November 2001. During the last
three months payrolls have fallen 0.4%.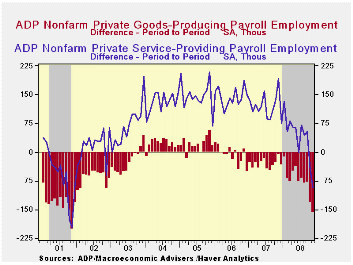
According to ADP and Macro Advisers, the correlation between the monthly percentage change in the ADP estimate and that in the BLS data is 0.90.
By the ADP measure, goods producing payrolls fell by 158,000
(-4.0% y/y). The largest decline was amongst medium sized payrolls
which fell 79,000 (-4.3% y/y) followed by a 47,000 (-2.6% y/y) drop in
small sized payrolls. Large payrolls fell 32,000 (-5.8% y/y).
Employment in the manufacturing sector fell 118,000 (-4.2% y/y) It has fallen in each month since late-2005.
Employment in the service producing industry added to the weakness in the goods producing sector. Payrolls fell 92,000 (+0.5% y/y), the first decline since 2001. Small service producing payrolls fell 32,000 (+1.1% y/y). Medium sized payrolls fell 51,000 (+0.3% y/y) and large service producing payrolls dropped by 9,000 (-0.6% y/y).
ADP compiled the estimate from its database of individual companies' payroll information. Macroeconomic Advisers, LLC, the St. Louis economic consulting firm, developed the methodology for transforming the raw data into an economic indicator.
The ADP National Employment Report data is maintained in Haver's
USECON database; historical data go back to December 2000. The figures in this report cover only private sector jobs and exclude employment in the public sector, which rose an average 11,083 during the last twelve months.The full ADP National Employment Report can be found here, and the ADP methodology is explained here.
| LAXEPA@USECON | November | October | Y/Y | 2007 | 2006 | 2005 |
|---|---|---|---|---|---|---|
| Nonfarm Private Payroll Employment (m/m Chg.) | -250,000 | -179,000 | -0.3% | 1.1% | 1.7% | 1.8% |
by Tom Moeller December 3, 2008
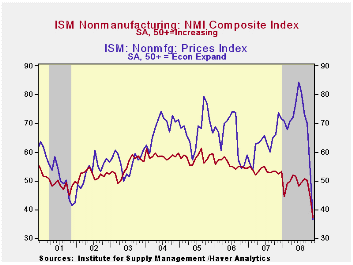
The November Composite Index for the nonmanufacturing sector from the Institute for Supply Management fell sharply to 37.3 from an unrevised 44.4 during October. The figure was weaker than Consensus expectations for a reading of 42.0 and it was the lowest in the series' relatively brief ten year history.
The nonmanufacturing business activity sub-index also fell sharply to 33.0 which was a record low for the series. Since the series' inception in 1997 there has been a 48% correlation between the level of the business activity index for the nonmanufacturing sector and the Q/Q change in real GDP for the services and the construction sectors.
The employment index fell to 31.3 which also was a new low for
the series. Since the series' inception in 1997 there has been a 56%
correlation between the level of the ISM nonmanufacturing employment
index and the m/m change in payroll employment in the service-producing
plus the construction industries.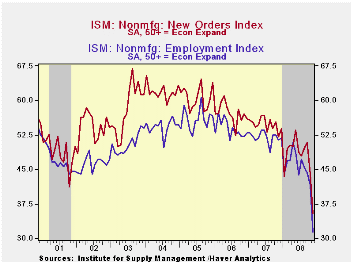
The new orders sub-index fell sharply to a recession level of 35.4.
Pricing power also collapsed. The reading of 36.6 was a new record low for the series. Since its inception ten years ago, there has been a 60% correlation between the price index and the q/q change in the GDP services chain price index.
Beginning with the January 2008 Nonmanufacturing Report On Business®, the composite index is calculated as an indicator of the overall economic condition for the non-manufacturing sector. It is a composite index based on the diffusion indexes for four of the indicators (business activity, new orders, employment and supplier deliveries) with equal weights. The latest report from the ISM can be found here.
ISM surveys more than 370 purchasing managers in more than 62 industries including law firms, hospitals, government and retailers. The nonmanufacturing survey dates back to July 1997.
| ISM Nonmanufacturing Survey | November | October | November '07 | 2007 | 2006 | 2005 |
|---|---|---|---|---|---|---|
| Composite Index | 37.3 | 44.4 | 52.4 | 53.5 | 55.7 | 58.0 |
| Prices Index | 36.6 | 53.4 | 73.7 | 63.8 | 65.3 | 68.0 |
by Tom Moeller December 3, 2008
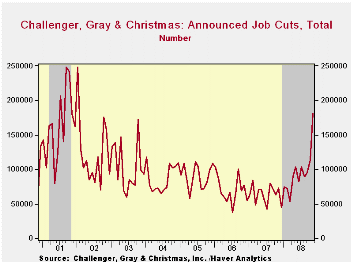
According to the Challenger, Grey & Christmas survey, layoffs jumped last month to their highest level since January of 2002, just following the last recession. The level of 181,671 was more than double the year-earlier level of 73,140. The three-month average level of layoffs at 129,883 was its highest also since 2002.
The rise in layoffs last month was led by 91,356 job cuts in financial industries and 5,459 cuts in the insurance industry. There also were 11,073 layoffs in the retail sector and 10,877 in the transportation industry.
During the last ten years there has been a 76% (inverse) correlation between the three-month moving average of announced job cuts and the three-month change payroll employment.
Job cut announcements differ from layoffs. Many are achieved through attrition, early retirement or just never occur.
The causes and consequences of economic restructuring: evidence from the early 21st century from the Federal Reserve Board can be found here.
| Challenger, Gray & Christmas | November | October | Y/Y | 2007 | 2006 | 2005 |
|---|---|---|---|---|---|---|
| Announced Job Cuts | 181,671 | 112,884 | 148.4% | 768,264 | 839,822 | 1,072,054 |
by Robert Brusca December 3, 2008
After Germany reported out such weak sales this month, the
gauntlet was thrown down of all of EMU. EMU sales are slipping and
doing so at an accelerating pace. They dropped by 0.8% in October
alone. The three-month growth rate is -2.6% the 6-month growth rate is
-1.6% but that is a bit better than the 12-month pace at -2.3%. Food
purchases are stabilizing to some extent but nonfood sales are in a
slide that is gathering sharp downward momentum.
The growth rates for the PRODUCT CATEGORIES do not show the
slowing in the headlines because they are only current through Sept. It
seems that much of the weakness in nominal sales is recent and is
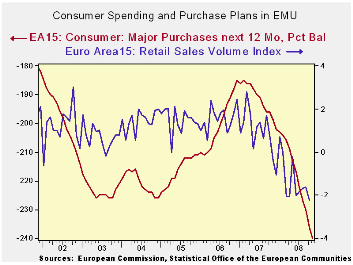
masked by the pick up in inflation. The chart shows the growth of EMU
retail sales volumes. Its trends revels clearly that sales volume
trends have been decelerating sharply and that sales are shrinking.
The EMU PMI indices have been showing deterioration most
sharply in the past few months. Moreover those series are more topical
with observations for November while retail sales headlines are
available for October and component data are fresh only through
September. The more topical data and the inflation adjusted data tell
the most pessimistic story and unfortunately these are the more
reliable reports at the moment.
The European consumer will be contributing to this weakness
more in the coming months. Dropping consumer confidence and a sharp cut
in the German auto industry’s outlook for its sales contribute to such
a view. The spike up in Ireland’s rate of unemployment to its highest
mark since 1998 and Spain’s drop in consumer confidence are further
signs of growing and widespread deterioration. The signs of weakness
are there throughout the Zone and the UK and are they growing in
intensity and spreading across the region. Any European that though
that the slowdown would be confined to the ‘other side of the pond’ is
now thoroughly disabused of that notion.
| Ezone (15) Retail Sales Volume | ||||||
|---|---|---|---|---|---|---|
| Oct-08 | Sep-08 | Aug-08 | 3-Mo | 6-Mo | 12-Mo | |
| Euro Area 15 Total | -0.8% | 0.0% | 0.1% | -2.6% | -1.2% | -2.3% |
| Food | -0.5% | 0.1% | 0.4% | 0.0% | -1.5% | -2.5% |
| Nonfood | -0.9% | 0.0% | -0.1% | -3.8% | -0.6% | -2.0% |
| Textiles | #N/A | 2.6% | -1.7% | 14.0% | 12.5% | -0.9% |
| Books news | #N/A | -0.2% | 0.0% | 3.0% | 1.8% | 0.0% |
| Pharmaceuticals | #N/A | -0.2% | 0.4% | 1.8% | 2.5% | 1.6% |
| Other Nonspecial | #N/A | -0.5% | -0.5% | -0.4% | -1.1% | -3.2% |
| Mail Order | #N/A | 1.0% | -1.9% | 10.7% | 6.2% | 2.3% |
| Country detail: Volume | ||||||
| Germany: Volume excl Auto | -1.6% | -1.0% | 1.6% | -3.9% | -2.2% | -1.4% |
| Italy (Total Value) | #N/A | 0.3% | -0.5% | 1.5% | 0.4% | 0.0% |
| UK (EU): Volume | -0.1% | -0.6% | 1.1% | 1.7% | 1.7% | 2.0% |
| Shaded areas calculated on a one-month lag due to lagging data | ||||||

Tom Moeller
AuthorMore in Author Profile »Prior to joining Haver Analytics in 2000, Mr. Moeller worked as the Economist at Chancellor Capital Management from 1985 to 1999. There, he developed comprehensive economic forecasts and interpreted economic data for equity and fixed income portfolio managers. Also at Chancellor, Mr. Moeller worked as an equity analyst and was responsible for researching and rating companies in the economically sensitive automobile and housing industries for investment in Chancellor’s equity portfolio. Prior to joining Chancellor, Mr. Moeller was an Economist at Citibank from 1979 to 1984. He also analyzed pricing behavior in the metals industry for the Council on Wage and Price Stability in Washington, D.C. In 1999, Mr. Moeller received the award for most accurate forecast from the Forecasters' Club of New York. From 1990 to 1992 he was President of the New York Association for Business Economists. Mr. Moeller earned an M.B.A. in Finance from Fordham University, where he graduated in 1987. He holds a Bachelor of Arts in Economics from George Washington University.
More Economy in Brief


