 Global| Jun 02 2005
U.S. Light Vehicle Sales Fell
by:Tom Moeller
|in:Economy in Brief
Summary
May sales of light vehicles reversed all of the prior month's gain and fell 4.5% to 16.67M according to the Autodata Corporation. Car sales were notably weak following a firm April and fell 7.5%. So far this year the average level of [...]
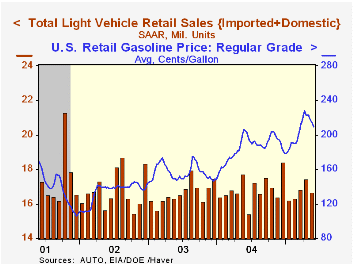
May sales of light vehicles reversed all of the prior month's gain and fell 4.5% to 16.67M according to the Autodata Corporation.
Car sales were notably weak following a firm April and fell 7.5%. So far this year the average level of car sales is 1.2% above last year.
Sales of light trucks fell 2.0% m/m to 9.14M. The average of truck sales so far this year is down 2.1% versus the first five months of 2004.
Imports' share of the US market for new vehicles was about stable at 20.5% in May, up from 19.9% in 2004.
Gasoline prices fell to an average $2.10 per gallon during the last week of May, down 8.0% from the weekly high of $2.28 in early April but still up 13.2% from last year's average $1.85.
| Light Vehicle Sales (SAAR, Mil. Units) | May | April | Y/Y | 2004 | 2003 | 2002 |
|---|---|---|---|---|---|---|
| Total | 16.67 | 17.46 | -5.9% | 16.88 | 16.63 | 16.81 |
| Autos | 7.53 | 8.14 | -4.7% | 7.49 | 7.62 | 8.07 |
| Trucks | 9.14 | 9.32 | -6.9% | 9.39 | 9.01 | 8.74 |
by Tom Moeller June 2, 2005
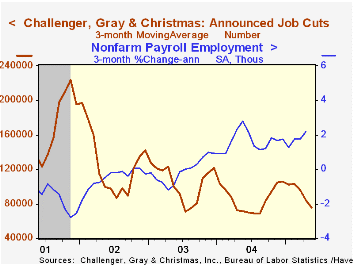
Job cut announcements jumped in May, however, the 42.2% m/m rise did not reverse all of the prior month's plunge. Therefore, the three month average of job cut announcements fell further to the lowest level since last August.
During the last ten years there has been an 84% (inverse) correlation between the three month moving average of announced job cuts and the three month change payroll employment.
Job cut announcements rose sharply m/m in the apparel (+234% y/y), computer (496% y/y) and insurance (321% y/y) industries but fell broadly elsewhere.
Job cut announcements differ from layoffs. Many are achieved through attrition, early retirement or just never occur.
Challenger also reported that announced hiring plans fell for the second month in the last three.
| Challenger, Gray & Christmas | May | April | Y/Y | 2004 | 2003 | 2002 |
|---|---|---|---|---|---|---|
| Announced Job Cuts | 82,283 | 57,861 | 12.2% | 1,039,175 | 1,236,426 | 1,431,052 |
by Tom Moeller June 2, 2005
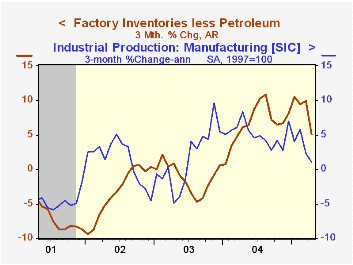
Factory inventories rose just 0.1% in April following an upwardly revised 0.7% gain in March. These gains lowered the three month growth in inventories to 5.8%, nearly half the high rate of accumulation set last summer.
These figures have been bloated by the surge in oil prices. Less petroleum, factory inventories rose 0.1% (8.1% y/y) in April and the three month rate of accumulation slowed to 5.1% versus 10.9% in August.
A slower rate of inventory accumulation has been notable in the furniture industry where three month growth fell to 2.8% from a high of 28.4%. Accumulation of electrical equipment about halved to 9.6% and the level of computer inventories has declined versus a double digit rate of accumulation last summer. The slowdown in other industries has been widespread.
Factory shipments rose a firm 0.7% but here again the trend has weakened. Three month growth fell to 3.1% from a high of 20.4%. Less petroleum recent growth in shipments has been negative versus 17% growth a year ago.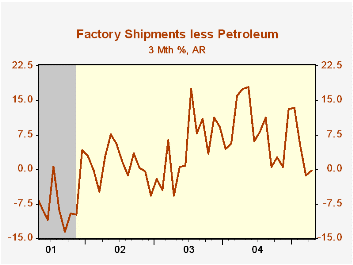
Orders to the factory sector rose 0.9%, juiced by a 1.9% rise in durable goods orders which was unrevised from the advance report.
Unfilled orders were unchanged and the ratio of unfilled orders to shipments fell to a new low.
Do Technological Improvements in the Manufacturing Sector Raise or Lower Employment? from the Federal Reserve Bank of Philadelphia can be found here.
| Factory Survey (NAICS) | April | March | Y/Y | 2004 | 2003 | 2002 |
|---|---|---|---|---|---|---|
| Inventories | 0.1% | 0.7% | 8.6% | 7.5% | -1.3% | -1.8% |
| New Orders | 0.9% | 0.7% | 6.8% | 10.9% | 3.7% | -1.9% |
| Shipments | 0.7% | 1.6% | 7.8% | 10.5% | 2.6% | -2.0% |
| Unfilled Orders | 0.0% | -0.2% | 6.3% | 9.1% | 4.2% | -6.1% |
by Tom Moeller June 2, 2005
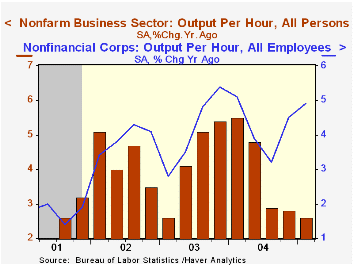
Non-farm labor productivity growth about matched Consensus expectations and was revised higher to 2.9%. A surprise, however, was that compensation costs were revised up in 1Q to 6.3% and up sharply to 10.4% in 4Q04.
As a result of revisions to compensation, unit labor cost growth accelerated to 4.3% versus 1Q '04 versus an upwardly revised 0.8% during 2004.
Productivity in the nonfinancial corporate sector rose 2.7% (4.9% y/y) following 9.0% growth during 4Q '04. Compensation, however, rose 6.8% after a 10.2% 4Q rise and caused unit labor costs to rise 4.1% (2.0% y/y). The ratio of prices to unit labor costs fell to the lowest level in a year, confirming the crimp on 1Q profits.
Does Wage Inflation Cause Price Inflation? from the Federal Reserve Bank of Cleveland can be found here.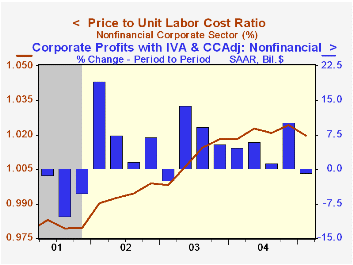
| Non-farm Business Sector (SAAR) | 1Q '05 (Revised) | 1Q '05 | 4Q '04 | Y/Y | 2004 | 2003 | 2002 |
|---|---|---|---|---|---|---|---|
| Output per Hour | 2.9% | 2.6% | 2.3% | 2.6% | 4.0% | 4.3% | 4.3% |
| Compensation | 6.3% | 4.8% | 10.2% | 7.0% | 4.8% | 4.0% | 3.2% |
| Unit Labor Costs | 3.3% | 2.2% | 7.7% | 4.3% | 0.8% | -0.3% | -1.1% |
by Tom Moeller June 2, 2005
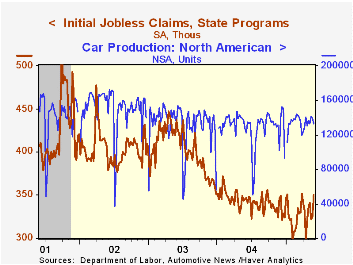
Initial claims for unemployment insurance jumped 25,000 last week to 350,000, the highest level since late March. The prior week's level was revised up slightly and Consensus expectations had been for 325,000 claims.
The rise in claims was at least partially due to temporary auto industry layoffs not related to regular summer plant shutdowns for retooling.
During the last ten years there has been a (negative) 75% correlation between the level of initial claims for unemployment insurance and the monthly change in payroll employment. There has been a (negative) 65% correlation with the level of continuing claims.
The four week moving average of initial claims rose to 334,500 (-2.6% y/y).
Continuing claims for unemployment insurance reversed all of the prior week's decline and rose 32,000 to the highest level in six weeks.
The insured unemployment rate remained stable at 2.0% for the sixth consecutive week.
| Unemployment Insurance (000s) | 05/28/05 | 05/21/05 | Y/Y | 2004 | 2003 | 2002 |
|---|---|---|---|---|---|---|
| Initial Claims | 350 | 325 | 1.4% | 343 | 402 | 404 |
| Continuing Claims | -- | 2,602 | -12.8% | 2,926 | 3,531 | 3,570 |
by Carol Stone June 2, 2005
In the May edition of "Haver Analytics News", we announced the availability of the CEIC China Premium Database. This new database, CHINA, has over 125,000 series covering many, many facets of Chinese economic life. The level of detail is extensive, including such items as the number of visitors to China who arrive on foot in any given month, the prices for common Portland cement by intensity and the gross domestic product of Shanghai, annually, by industry.
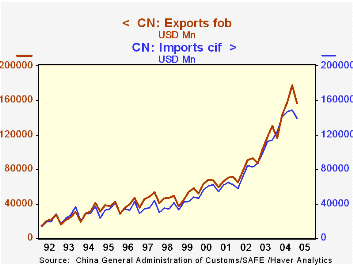
Earlier this week, the General Administration of Customs reported foreign trade data for April. The surplus was $4.6 million, consisting of $62.2 billion in exports and $57.6 billion in imports. On examining these figures over time, we were startled to find that, while trade surpluses prevail, the trend is not nearly the one-sided imbalance that one might envision. In fact, there has even been the occasional monthly trade deficit. During the last 12 months, the surplus has averaged $5.4 billion, equivalent to just about 10% of China's exports. By contrast, in Japan, the 12-month average trade surplus has represented 23% of exports and in Germany, 21%, much larger proportional imbalances than in China.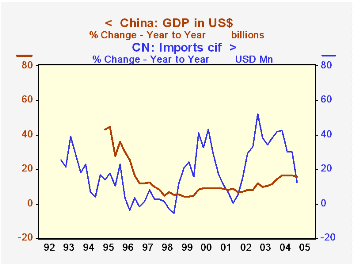
Thus, not only are China's exports large and growing rapidly, so are China's imports. In 2004, exports of goods totaled $593.6 billion, up 35.4% from 2003. Imports were $560.8 billion, up 35.8%. Just in the last three months, however, imports have slowed, so their average for February, March and April is "just" 10.8% higher than a year ago. Products contributing most to the lessening pace include textiles, paper and several machinery categories. At the same time, as elsewhere, petroleum imports continue to grow strongly, along with its derivatives, chemicals and plastics. Some durable goods remain strong as well, including wood products and electrical equipment.
In the second graph here, we show imports growth along with that of GDP. We see that most of the time since 1999 imports have grown faster than GDP. Thus, even as trade accounts run surpluses, China clearly spends a sizable portion of its export earnings on imported products. A concentration in machinery suggests that building and upgrading plants is a major priority.
| China Millions of US$ |
12-Mo Avg, Apr 2005 | Apr 2005 | Mar 2005 | Apr 2004 | Monthly Averages|||
|---|---|---|---|---|---|---|---|
| 2004 | 2003 | 2002 | |||||
| Trade Balance | 5392 | 4591 | 5733 | -2250 | 2736 | 2115 | 2528 |
| Exports, fob | 54071 | 62151 | 60869 | 47124 | 49471 | 36540 | 27137 |
| Imports, cif | 48680 | 57560 | 55136 | 49374 | 46734 | 34425 | 24609 |

Tom Moeller
AuthorMore in Author Profile »Prior to joining Haver Analytics in 2000, Mr. Moeller worked as the Economist at Chancellor Capital Management from 1985 to 1999. There, he developed comprehensive economic forecasts and interpreted economic data for equity and fixed income portfolio managers. Also at Chancellor, Mr. Moeller worked as an equity analyst and was responsible for researching and rating companies in the economically sensitive automobile and housing industries for investment in Chancellor’s equity portfolio. Prior to joining Chancellor, Mr. Moeller was an Economist at Citibank from 1979 to 1984. He also analyzed pricing behavior in the metals industry for the Council on Wage and Price Stability in Washington, D.C. In 1999, Mr. Moeller received the award for most accurate forecast from the Forecasters' Club of New York. From 1990 to 1992 he was President of the New York Association for Business Economists. Mr. Moeller earned an M.B.A. in Finance from Fordham University, where he graduated in 1987. He holds a Bachelor of Arts in Economics from George Washington University.
More Economy in Brief


