 Global| May 04 2005
U.S. Light Truck Sales Crimped by Higher Gasoline Prices
by:Tom Moeller
|in:Economy in Brief
Summary
Sales of light vehicles in April managed to rise 3.7% versus March despite a meager 1.6% gain in sales of light trucks. According to Autodata Corporation total light vehicle sales rose to 17.46M. Gasoline prices averaged a record [...]
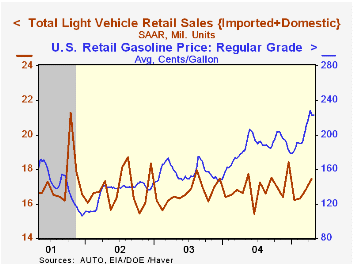
Sales of light vehicles in April managed to rise 3.7% versus March despite a meager 1.6% gain in sales of light trucks. According to Autodata Corporation total light vehicle sales rose to 17.46M.
Gasoline prices averaged a record $2.24 per gallon last month, up 25% versus a year earlier. In May, gasoline have backed off somewhat from last month's weekly high of $2.28 but the gain versus last year still is 21%.
The rise in sales of light trucks to 9.32M left the average of sales so far this year down 3.5% versus 9.06M during all of 2004. Sales of domestically made trucks rose 1.0% m/m (0.4% y/y) but sales of imported trucks jumped 5.6% (8.4% y/y).
Total auto sales rose 6.1% last month and the gain pulled the average level this year up 2.1% versus last.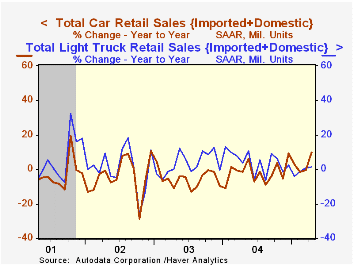
Imports' share of the US market for new vehicles rose to 20.6% in April and has averaged 20.2% this year versus 19.9% in 2004.
| Light Vehicle Sales (SAAR, Mil. Units) | April | March | Y/Y | 2004 | 2003 | 2002 |
|---|---|---|---|---|---|---|
| Total | 17.46 | 16.85 | 5.0% | 16.88 | 16.63 | 16.81 |
| Autos | 8.14 | 7.68 | 9.6% | 7.49 | 7.62 | 8.07 |
| Trucks | 9.32 | 9.17 | 1.4% | 9.39 | 9.01 | 8.74 |
by Tom Moeller May 4, 2005
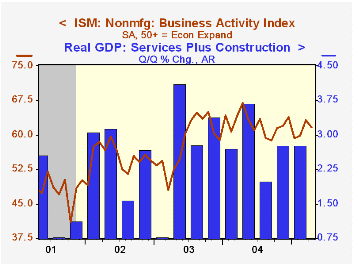
The Institute for Supply Management reported that the April Business Activity Index for the non-manufacturing sector fell to 61.7 from 63.1 in March. The index had risen for two successive months but because of a sharp decline in January the average level so far this year of 61.0 is below the 2004 average. Consensus expectations had been for a reading of 61.0 in April.
Since the series' inception in 1997 there has been a 50% correlation between the Business Activity Index and the q/q change in real GDP for services plus construction.
The new orders index dropped sharply to 58.8, its lowest in nearly two years, while the employment sub index also fell to the lowest level since January. Since the series' inception in 1997 there has been a 60% correlation between the level of the ISM non-manufacturing employment index and the m/m change in payroll employment in the service producing plus the construction industries.
Pricing power fell again m/m to the lowest level in over a year.
ISM surveys more than 370 purchasing managers in more than 62 industries including construction, law firms, hospitals, government and retailers. The non-manufacturing survey dates only to July 1997, therefore its seasonal adjustment should be viewed tentatively.Business Activity Index for the non-manufacturing sector reflects a question separate from the subgroups mentioned above. In contrast, the NAPM manufacturing sector composite index is a weighted average five components.
| ISM Nonmanufacturing Survey | April | March | April '04 | 2004 | 2003 | 2002 |
|---|---|---|---|---|---|---|
| Business Activity Index | 61.7 | 63.1 | 66.9 | 62.4 | 58.2 | 55.1 |
| Prices Index | 61.9 | 65.6 | 66.9 | 69.0 | 56.8 | 54.0 |
by Tom Moeller May 4, 2005
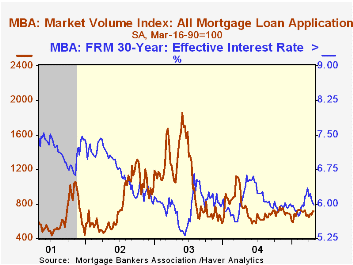
Total mortgage applications ticked up 0.2% last week but the change left the average level in April down 0.9% from March and down a third from last year's peak level, according to the Mortgage Bankers Association.
Applications to purchase a home were about unchanged w/w. Still, the April average rose 2.7% from March which rose 6.1% from February. During the last ten years there has been a 50% correlation between the y/y change in purchase applications and the change in new plus existing single family home sales.
Applications to refinance ticked 0.4% higher and the average in April fell 5.5% from March which fell 16.1% from February.
The effective interest rate on a conventional 30-year mortgage fell to 5.98% from 6.01%, the lowest level since early March. The effective rate on a 15-year mortgage also fell to 5.62%.
The Mortgage Bankers Association surveys between 20 to 35 of the top lenders in the U.S. housing industry to derive its refinance, purchase and market indexes. The weekly survey accounts for more than 40% of all applications processed each week by mortgage lenders. Visit the Mortgage Bankers Association site here.
| MBA Mortgage Applications (3/16/90=100) | 04/29/05 | 04/22/05 | Y/Y | 2004 | 2003 | 2002 |
|---|---|---|---|---|---|---|
| Total Market Index | 714.1 | 712.4 | -8.6% | 735.1 | 1,067.9 | 799.7 |
| Purchase | 482.5 | 482.0 | 0.0% | 454.5 | 395.1 | 354.7 |
| Refinancing | 2,061.2 | 2,052.5 | -18.1% | 2,366.8 | 4,981.8 | 3,388.0 |
by Carol Stone May 4, 2005
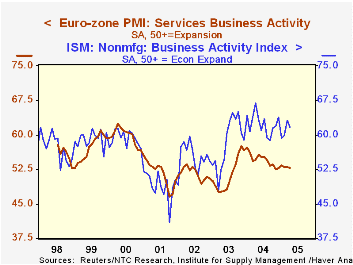
Business activity in European service industries maintained a stable rate of modest expansion in April, according to the purchasing manager surveys conducted by NTC Research and reported today by Reuters, Inc.
T he overall services business activity index registered 52.76, off just slightly from March's 52.99. This index, a "net balance" indicator (% rising - % falling) has hovered around 53 for the last six months after slowing pretty consistently over the previous year. It had reached a peak of 57.5 in November 2003. Among the associated measures, new business and outstanding business both resemble the pattern in the "business activity" gauge, while employment has actually had a slight firming tendency over this general 18-month period.
An interesting facet of the European-wide information is an apparent worsening of profit margins. The index for prices charged narrowed by 1.9 points and fell below 50, showing that selling prices rose at fewer companies than they fell. But input prices increased on balance, from 57.72 to 57.98. This is not unusually high for this measure, but it does suggest that operating costs are exerting some pressure on these service producers. After five months of relative improvement in margins, in a single month this spread between selling prices and input prices lost some 45% of that improvement. The input prices, not surprisingly, are strongly influenced by import prices and other wholesale prices. In fact, correlation ratios between this services input price index and various price indicators, including the Euro-Zone import price index, producer price index and producer price index for energy, all run in a range of 80-90%. So rising energy prices as well as prices of other materials are weighing on service sector performance at the same time that these firms are unable to sustain rising selling prices to customers.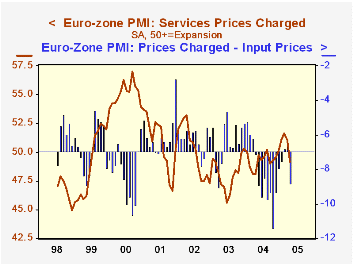
Among various countries, recent business activity performances have differed. As seen in the table below, Germany's business activity index fell by about half-a-point in April, while that in France rose more than 3 points. The Italian index was off 4.34 points and in fact, with a reading below 50, showed an outright contraction in its service sector.
| PMI for Service Sector | April 2005 | March 2005 |
|---|---|---|
| Euro-Zone* | 52.76 | 52.99 |
| Germany | 51.32 | 51.80 |
| France | 57.69 | 55.44 |
| Italy | 48.35 | 52.69 |

Tom Moeller
AuthorMore in Author Profile »Prior to joining Haver Analytics in 2000, Mr. Moeller worked as the Economist at Chancellor Capital Management from 1985 to 1999. There, he developed comprehensive economic forecasts and interpreted economic data for equity and fixed income portfolio managers. Also at Chancellor, Mr. Moeller worked as an equity analyst and was responsible for researching and rating companies in the economically sensitive automobile and housing industries for investment in Chancellor’s equity portfolio. Prior to joining Chancellor, Mr. Moeller was an Economist at Citibank from 1979 to 1984. He also analyzed pricing behavior in the metals industry for the Council on Wage and Price Stability in Washington, D.C. In 1999, Mr. Moeller received the award for most accurate forecast from the Forecasters' Club of New York. From 1990 to 1992 he was President of the New York Association for Business Economists. Mr. Moeller earned an M.B.A. in Finance from Fordham University, where he graduated in 1987. He holds a Bachelor of Arts in Economics from George Washington University.
More Economy in Brief


