 Global| Jun 22 2007
U.S. Leading Economic Indicators Up for Second Time This Year
by:Tom Moeller
|in:Economy in Brief
Summary
The composite index of leading economic indicators rose an expected 0.3% last month and fully recouped a 0.3% decline during April. The May gain was only the second monthly increase this year, according to the Conference Board and [...]
The composite index of leading economic indicators rose an expected 0.3% last month and fully recouped a 0.3% decline during April. The May gain was only the second monthly increase this year, according to the Conference Board and left the leaders up just 0.3% y/y.
During the last ten years there has been a 59% correlation between the y/y change in the leading indicators and the lagged change in real GDP.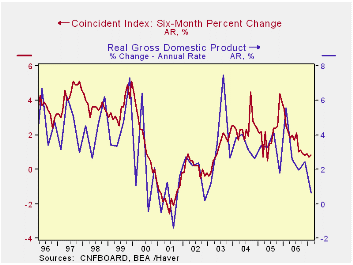
The breadth of one month gain amongst the 10 components of the leading index remained at a low 55% after a 30% rise amongst the leaders’ components’ during April.
Lower initial claims for unemployment insurance, higher building permits and higher stock prices accounted for most of the gain in the leading index last month. Capital goods orders and the money supply fell.
The method of calculating the contribution to the leading index from the spread between 10 year Treasury securities and the Fed funds rate has been revised. A negative contribution will now occur only when the spread inverts rather than when declining as in the past. More details can be found here. 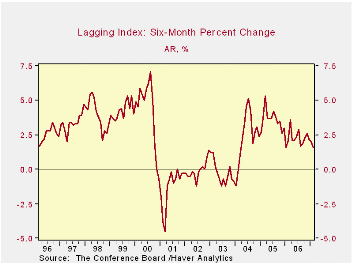
The leading index is based on eight previously reported economic data series. Two series, orders for consumer goods and orders for capital goods, are estimated.
The coincident indicators increased 0.2% after a 0.1% rise during May. Over the last ten years there has been a 91% correlation between the y/y change in the coincident indicators and real GDP growth.
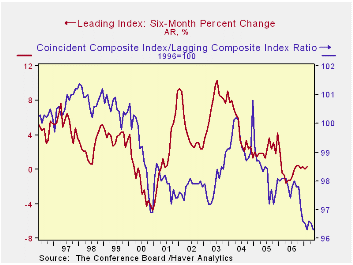
The lagging index rose the same 0.2% as during May. As a result the ratio of coincident to lagging indicators (a measure of economic excess) fell during May following a slight decline the prior month.Visit the Conference Board's site for coverage of leading indicator series from around the world.
| Business Cycle Indicators | May | April | Y/Y | 2006 | 2005 | 2004 |
|---|---|---|---|---|---|---|
| Leading | 0.3% | -0.3% | 0.3% | 1.2% | 2.5% | 7.1% |
| Coincident | 0.2% | 0.1% | 1.8% | 2.5% | 2.1% | 2.0% |
| Lagging | 0.2% | 0.2% | 3.2% | 3.0% | 3.5% | 0.6% |
by Robert Brusca June 22, 2007
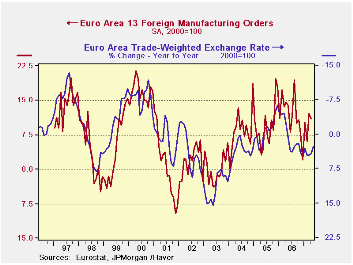
European orders fell by 0.4% in April, less than expected, as bulk orders rose and boosted the headline. And while bulk orders do ‘count’ they can often blur the trend and mask changes. That is probably the effect right now as European industrial orders are headed for a fall while everyone is ignoring that FACT. That’s right, not an opinion, but a FACT of history. The trend for orders GROWTH is already lower and orders GROWTH follows closely movements in the euro exchange rate and follows that inversely. The EURO – broadly defined, weighted by trade and inflation adjusted - has been rising and still is. In terms of its level the EURO is VERY strong. Orders have showed some resiliency. But the chart on the left shows that there always are flares of countertrend movements that eventually prove to be not sustainable. AND orders, while on an upswing, are still contained within the confines of a descending channel much like a rally in a bear chart for bonds or stocks.
For now order trends in the EU are still looking OK (see table). But MFG sales within the Euro area have slowed and slowed sharply for consumer goods and even have slowed for the nearly bullet-proof Capital Goods sector. Domestic orders have showed a sharper fall-off than foreign orders but foreign orders are still obeying the BIG PICTURE law that says with a strong euro they too must fall (it is this series that is plotted on the chart, but the overall series plots almost as well). For the moment two factors are supporting orders in EU. One is this short-term monthly bump up in bulk orders. This sort of thing comes and goes. We expect orders will bulk up from time to time but by smaller amounts moving forward. The other factor is the fact that a lot of the Euro area orders are to non-euro area or aspiring euro area countries that are close by, maintain a tight ‘peg’ to the euro and where historic ties continue to confer advantages to EMU producers. The longer the Euro remains strong, the more likely that competition (apparently the new ‘dirty word’ in the EU) will take hold in such places. Eurol exports to the US already have dropped very sharply. That is a function of slower US growth but also of the nose-bleed euro FX valuations. The strong euro is leaving plenty of ‘fingerprints’ around.
The table shows that on most measures orders growth over the past three months is still pretty strong. In April, however, there are three sizeable declines among the four largest economies in the EU. Of course one of the reasons that the three-month growth rates for these countries are still firm is that in one of the previous months each had a sizeable increase in orders. You cannot hang your hat on any monthly number as evidence of a trend change. Instead we appeal to the chart above.
The chart plots the real broad (trade-weighted) euro VS foreign order performance in the euro area since March of 2000. The relationship is reasonably tight and quite clear: euro up orders down; euro down orders up. Any questions? The euro is up and orders are still in a downtrend although they ‘flared’ to the top of their downward sloping channel this month. Betting that this relationship between orders and the euro will not repeat itself seems to be a grasp at a straw.
Moreover, if we plot orders against the LEVEL of the real exchange rate you see another reason to be a pessimist on order/export strength. The LEVEL of the real FX rate is extremely high. If short term movements in the rate matter, the level surely must matter. Some of the euro’s strength could have been seen in advance and hedged. But the longer the euro stays strong the more that profit margins are squeezed or eliminated and the less help that hedging can offer. We conclude that while it is volatile, the slowing trend in EMU orders is for real. Don’t you?
| SAAR except m/m | % m/m | Apr-07 | Apr-07 | Apr-07 | Apr-06 | Apr-05 | ||
| Euro area Detail | Apr-07 | Mar-07 | Feb-07 | 3-Mo | 6-mo | 12-mo | 12-mo | 12-mo |
| MFG Orders | -0.4% | 2.9% | -0.6% | 7.2% | 8.8% | 9.0% | 9.5% | 4.0% |
| MFG Sales | 0.0% | 0.3% | 0.5% | 3.3% | 6.6% | 6.3% | 7.5% | 2.9% |
| Consumer | 0.0% | 0.0% | 0.1% | 0.4% | 2.1% | 3.5% | 7.5% | 2.9% |
| Capital | 0.4% | 0.6% | 0.7% | 6.8% | 8.2% | 8.1% | 4.0% | 1.3% |
| Intermediate | 0.3% | 0.2% | 0.4% | 5.2% | 5.7% | 7.9% | 7.1% | 2.4% |
| MFG Orders | ||||||||
| Total Orders | -0.4% | 2.9% | -0.6% | 7.2% | 8.8% | 9.0% | 9.5% | 4.0% |
| EA13 Domestic MFG orders | -0.7% | 2.3% | -0.4% | 5.2% | 5.7% | 7.9% | 5.9% | 0.2% |
| EA13 Foreign MFG orders | -1.1% | 4.4% | 0.0% | 13.4% | 13.9% | 11.0% | 14.6% | 3.1% |
| Countries: | Apr-07 | Mar-07 | Feb-07 | 3-Mo | 6-mo | 12-mo | 12-mo | 12-mo |
| Germany | -1.0% | 1.0% | 4.2% | 17.5% | 11.3% | 9.7% | 14.5% | 1.0% |
| France | 2.1% | 5.2% | -7.8% | -3.9% | 12.0% | 18.3% | -0.1% | 1.5% |
| Italy | -1.1% | 4.8% | 0.4% | 17.2% | 4.2% | 2.3% | 15.7% | 2.0% |
| UK | -5.6% | 3.3% | 9.9% | 31.8% | 11.0% | -0.6% | 4.6% | 3.3% |
by Carol Stone June 22, 2007
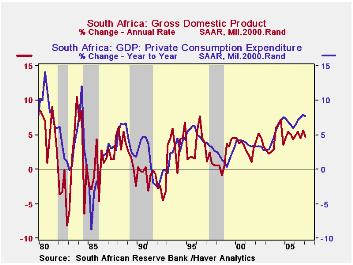
The South African economy is moving ahead vigorously, according to Q1 GDP data released yesterday by the South African Reserve Bank. Growth actually slowed to "just" 4.7% from Q4 at an annual rate, following 5.6%. Year-on-year growth was 5.4%. The trend has hovered around a 5% pace since 2004, a pick-up from about 3-1/2% in the previous four years. In the first graph, we show GDP and consumption since 1980, along with recession shading for South African business cycles. Recent GDP growth has been lower than in some periods, but much more consistent, so that highs are not soon offset by lows. The last recession ended in late 1998. 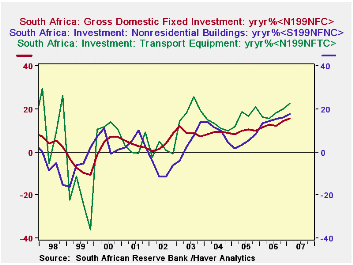
Investment has been the driving force over the last couple of years and expanded at nearly a 22% annual rate in Q1. Further detail (see second graph) shows substantial increases in nonresidential buildings and infrastructure, and additional detail on these expenditures by industry indicates that they are in transportation, communication and utilities. Some of these are coming off a low base, but expanding very rapidly, a sign of the vigor of development efforts in South Africa. Gross value added in the construction industry parallels this growth.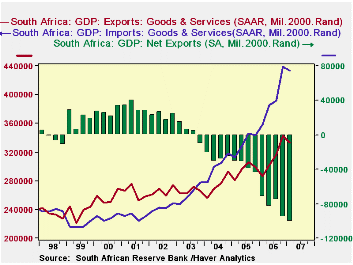
Consumer spending is hardly weak, either, with gains across the last five quarter exceeding 7% and even 8%. These are concentrated in goods, with spending on services less rapid. If there's a problem in South Africa's spending mix, it's in net exports. Exports themselves are fairly strong; they declined a bit in Q1 from Q4, but are still up 16.2% on the year-ago period. Imports are even stronger, though, with four-quarter growth right at 20%. Obviously much of the consumer and investment spending is sourced from foreign goods and services. A quick look at trade data shows marked growth in imports of metals, machinery, textiles, chemicals and even food products. As the South African economy moves ahead, we'd guess that this dependence on foreign goods would diminish.
| SOUTH AFRICA | Q1 2007* | Q4 2006* | Q3 2006* | Q1 2006 Yr/Yr | 2006 | 2005 | 2004 |
|---|---|---|---|---|---|---|---|
| Real GDP | 4.7 | 5.6 | 4.5 | 5.4 | 5.0 | 5.1 | 4.8 |
| Private Consumption | 7.4 | 7.8 | 7.6 | 7.6 | 7.3 | 6.6 | 6.7 |
| Fixed Investment | 21.8 | 16.4 | 14.0 | 15.6 | 12.7 | 9.6 | 8.9 |
| Net Exports (Bil.Rand) | -100.3 | -95.8 | -75.1 | -72.5 | -81.8 | -36.9 | -26.6 |
| GVA: Construction | 21.3 | 16.5 | 16.1 | 16.6 | 13.7 | 11.9 | 11.1 |
| Manufacturing | 4.7 | 8.3 | 4.7 | 5.7 | 4.8 | 5.0 | 4.7 |
by Robert Brusca June 22, 2007
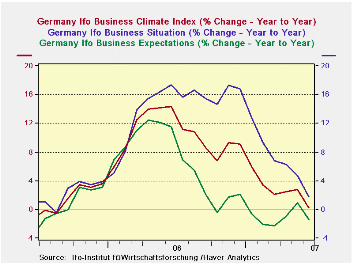
Germany's IFO index fell sharply in June from 108.6 to 107. It stood at 108.6 for two months in a row and peaked in this cycle back in December 2006 at 108.7. No wonder the IFO says that levels are still high and that the economy is still strong. But looked at another way, all this ebullience misses the point. The IFO survey has been weakening for some time. And here I refer to weakening in terms of its rate of growth. The IFO Climate headline hit a growth peak in June 2006, at just a tic higher than the pace it posted in November, a month before it hit its numeric peak for the index level. The index growth rate had been trapped in a narrow range around 16%. IFO growth had been strong and stayed in a narrow band from April to December of 2006. But, since then, the rate of growth has been dropping - sometimes sharply - as the chart above shows.
Both current conditions and expectations have lopped digits off their growth rates over this period. Expectations fell first dropping from a growth rate of 12.4% in April 2006 to below zero by October of the same year. Since April expectations growth has been waffling around the unchanged line. Current conditions growth, however, has continued to erode at a more or less steady pace. From March to May that erosion took a pause but in June current conditions are sharply lower again and the decline in the rate of growth is ‘back on’ track and has fallen to zero from over 14% in June of 2006.
The drop in the overall climate reading spreads across main sectors as the IFO sector diffusion readings tell us. Readings are still 'high valued’ as the percentage of range figures tell us at the far right of the table. Diffusion readings of climate peaked in April 2007; confidence peaked in December 2006, expectations peaked in March 2006. Still the month to month drop in June was sharp for most sectors; the decline in services was moderate.
And although IFO Chief Economist Gernot Nerb says he is not worried about exports and says that the export readings in the IFO survey are strong the truth is that those conditions have eroded dramatically across industry groups.
| CLIMATE Sum | Current | Last Mo | Since Jan 1991* | |||||
| Jun-07 | May-07 | average | Median | Max | Min | range | % range | |
| All Sectors | 13.2 | 16.3 | -8.8 | -9.5 | 16.6 | -30.6 | 47.2 | 92.8% |
| MFG | 23.9 | 27.5 | -1.1 | 0.3 | 27.5 | -35.5 | 63.0 | 94.3% |
| Construction | -16.0 | -14.6 | -29.2 | -32.2 | 0.3 | -50.7 | 51.0 | 68.0% |
| Wholesale | 14.3 | 18.3 | -14.8 | -16.5 | 23.3 | -39.6 | 62.9 | 85.7% |
| Retail | -5.0 | -3.2 | -14.8 | -14.8 | 25.3 | -40.3 | 65.6 | 53.8% |
| Services | 26.0 | 26.5 | 8.2 | 7.8 | 28.5 | -15.7 | 44.2 | 94.3% |
| * May 2001 for Services | ||||||||

Tom Moeller
AuthorMore in Author Profile »Prior to joining Haver Analytics in 2000, Mr. Moeller worked as the Economist at Chancellor Capital Management from 1985 to 1999. There, he developed comprehensive economic forecasts and interpreted economic data for equity and fixed income portfolio managers. Also at Chancellor, Mr. Moeller worked as an equity analyst and was responsible for researching and rating companies in the economically sensitive automobile and housing industries for investment in Chancellor’s equity portfolio. Prior to joining Chancellor, Mr. Moeller was an Economist at Citibank from 1979 to 1984. He also analyzed pricing behavior in the metals industry for the Council on Wage and Price Stability in Washington, D.C. In 1999, Mr. Moeller received the award for most accurate forecast from the Forecasters' Club of New York. From 1990 to 1992 he was President of the New York Association for Business Economists. Mr. Moeller earned an M.B.A. in Finance from Fordham University, where he graduated in 1987. He holds a Bachelor of Arts in Economics from George Washington University.
More Economy in Brief


